Figure 4.

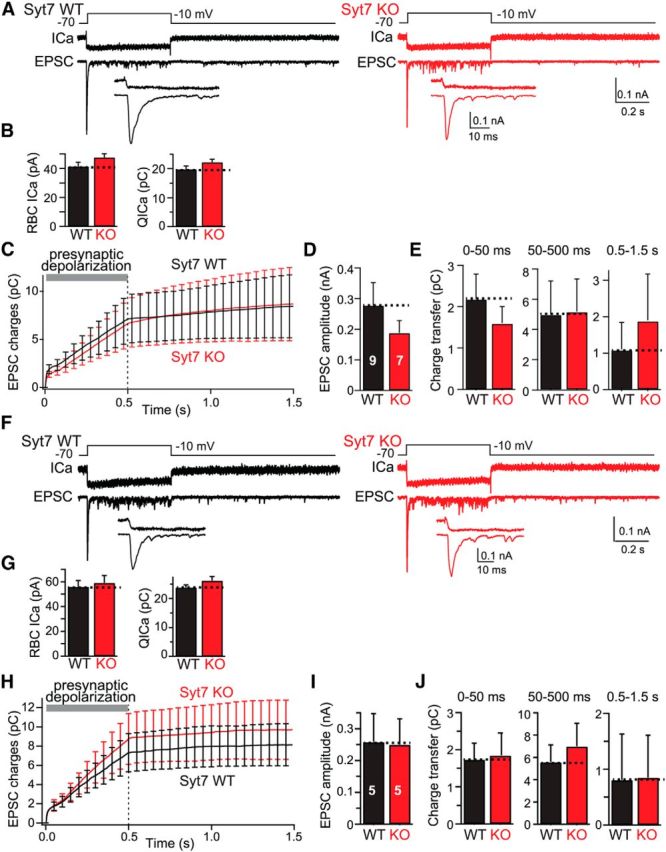
Introduction of a slow Ca2+ buffer (10 mm EGTA) into presynaptic RBCs blocks delayed asynchronous release and mimics the Syt7 KO phenotype. A, Experimental design (top), representative presynaptic Ca2+ current traces (ICa; middle), and postsynaptic EPSC traces (bottom) recorded from connected RBCs and AII cells from littermate WT (left) and Syt7 KO (right) mice. Insets (bottom) show expanded traces of the initial EPSCs. Experiments are as in Figure 2, except that the internal solution contained 10 mm EGTA instead of 1.3 mm BAPTA. B, Summary graph of the Ca2+ current amplitude (left) and integrated Ca2+ charge transfer (right) shows that the Syt7 KO has no effect on Ca2+ influx. C, Plot of the cumulative EPSC charge transfer during and after the 500 ms depolarization reveals that addition of 10 mm EGTA to the internal solution dramatically suppresses delayed asynchronous release in WT synapses but has no effect on Syt7 KO synapses, rendering delayed asynchronous release identical in WT and Syt7 KO synapses. D, Summary graph of peak EPSC amplitudes in WT and Syt7 KO mice. E, Summary graphs of the integrated charge transfer for fast synchronous release, sustained release, and delayed asynchronous release. Note that delayed asynchronous release in WT synapses is suppressed by the internal 10 mm EGTA to those of Syt7 KO synapses. F–J, Same as in A–E, except that all recordings were performed with an internal pipette solution containing both 1.3 mm BAPTA and 10 mm EGTA. All data are means ± SEMs (n = 5–9). Statistical analyses were performed by Student's t test comparing Syt7 KO with WT littermates, except an ANOVA followed by the post hoc Bonferroni's test was used in C, E, H, and J, but no statistically significant differences were noted.
