Figure 6.

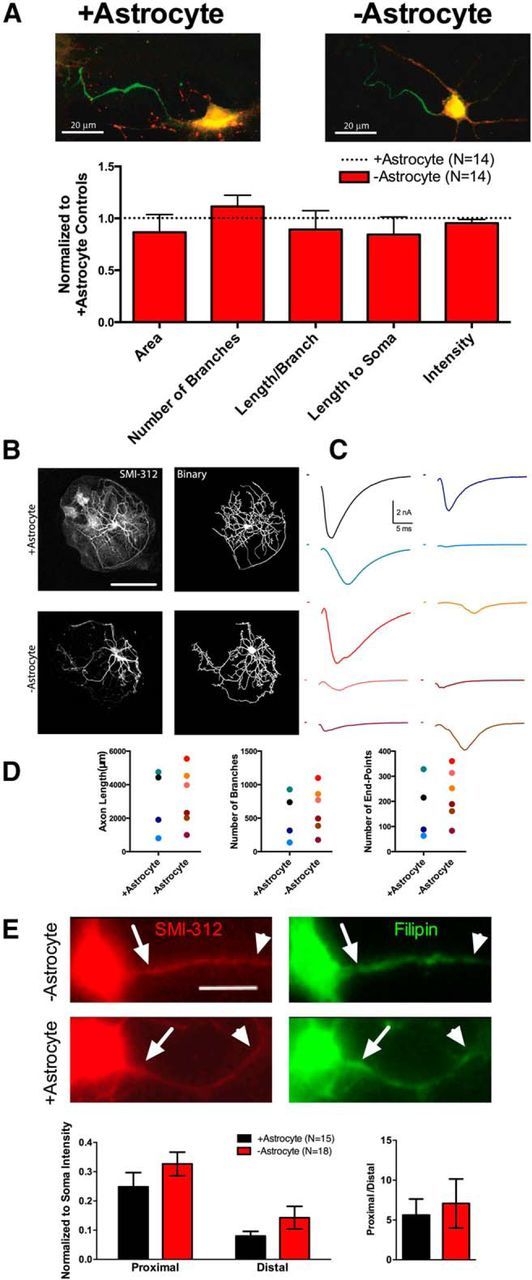
−Astrocyte and +astrocyte axons have similar physical properties. A, Example pan-Nav immunostaining (green; vGluT1, red) of a +astrocyte neuron (left) and −astrocyte neuron (right). The bar graph quantifies staining intensity, size, and location for −astrocyte neurons (red bars; n = 13) compared to +astrocyte controls (black dotted line; n = 14). −Astrocyte AIS immunostaining values were normalized to +astrocyte neuron immunostaining values. B, C, Distal axon morphology and EPSCs were compared between +astrocyte and −astrocyte glutamatergic neurons. B, Representative SMI-312 staining (left) of +astrocyte (top row) and −astrocyte (bottom row) glutamatergic neurons. Immunostaining was thresholded and binarized (right) for subsequent axon length and branching measurements. (For a description, see Materials and Methods.) C, EPSCs from +astrocyte neurons (n = 4; black and blue hues) and −astrocyte neurons (n = 6; red hues) before fixation and SMI-312 immunostaining. D, Plots of axon length (left), number of branch points (middle), and number of end points (right) for all +astrocyte (blue hue dots) and −astrocyte (red hue dots) neurons recorded and measured. The color of the dots corresponds with the color of EPSCs displayed in C. E, Representative SMI-312 (left) and filipin (right) stains for −astrocyte (top row) and +astrocyte (bottom row) glutamatergic neurons, verified in preceding whole-cell recordings. Proximal (arrows) and distal (arrowheads) axon regions of interest were defined on SMI-312 images and subsequently used to measure filipin intensity via background-subtracted line scan analyses. These analyses are quantified in the bar graphs (+astrocytes, n = 15; −astrocytes, n = 18). Filipin intensity was normalized to somatic filipin intensity to account for variations in staining intensity between biological replicates. Scale bars: A, E, 20 μm; B, 100 μm.
