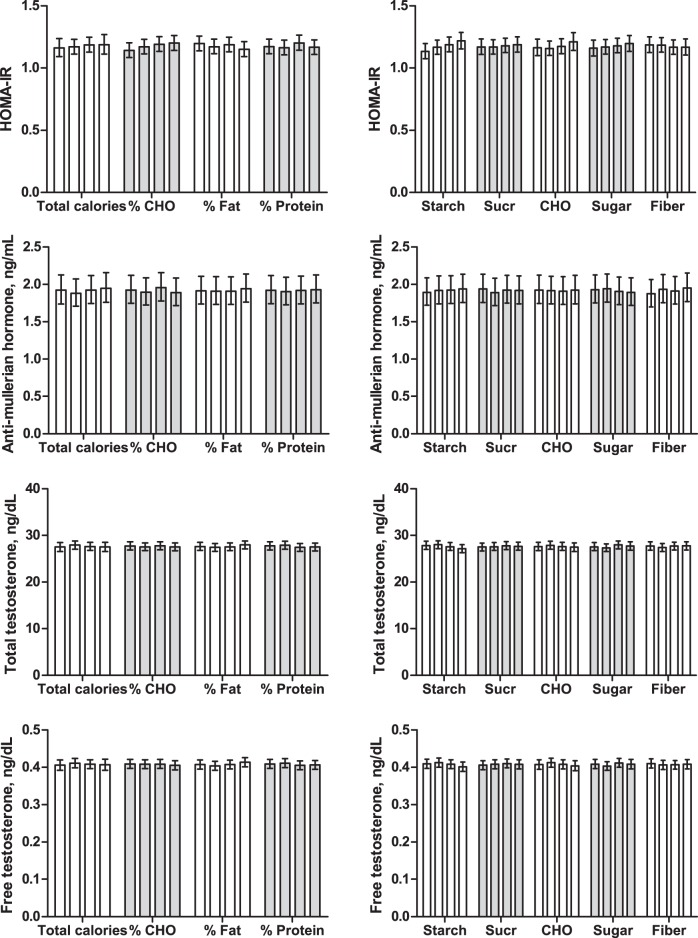
Figure 1.
Metabolic and reproductive hormones across quartiles of dietary intake. Data are geometric means and 95% confidence intervals. Bars reflect the lowest to highest quartile of dietary intake, left to right within each diet factor. Actual ranges of intake by quartile are defined for each diet factor in Table 2. No significant differences across quartiles of dietary intake were detected for any hormone outcome. CHO, total carbohydrate; Sucr, sucrose; fiber, water-soluble dietary fiber; %, reflects percentage of total calories.

