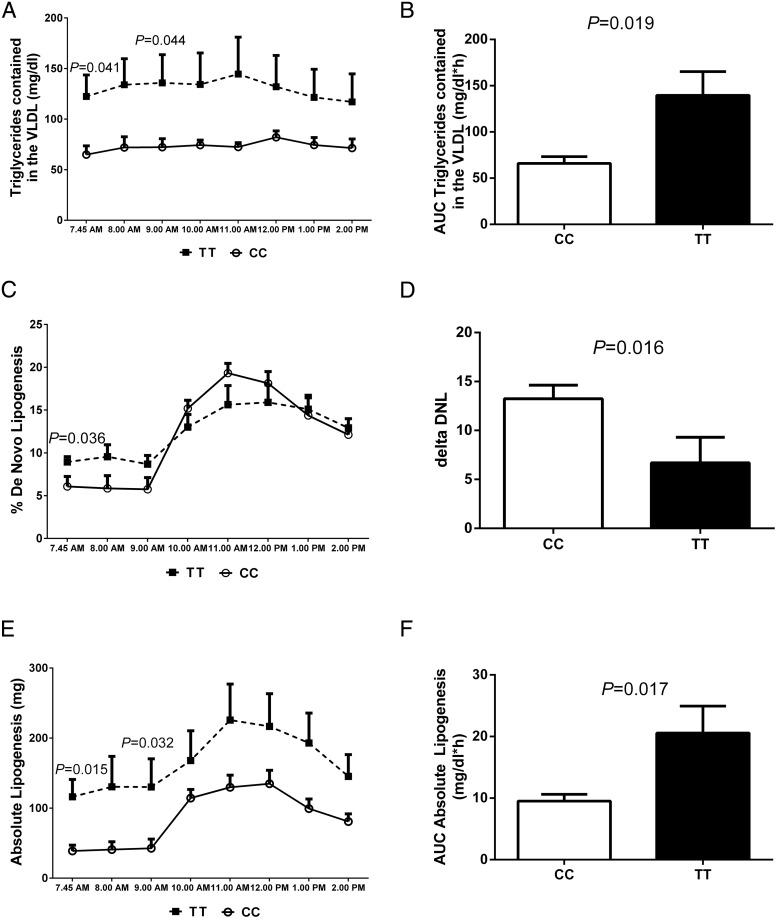
Figure 3.
Changes in VLDL-TG concentration and fractional and absolute DNL. Values are mean ± SEM data for the plasma concentration of VLDL-TG (A), area under the curve (AUC) of VLDL-TG (B), fractional DNL (C), delta increase DNL (D), rates of absolute lipogenesis (E), and AUC of the rates of absolute lipogenesis (F) according to the GCKR rs1260326 genotypes. The dashed lines represent the TT, and each time point is shown as a closed square; the continuous lines represent the CC, and each time point is represented by an open circle. White bars represent the CC, and black bars represent the TT. The groups were compared by a paired t test. P values are given only for statistically significant comparisons.

