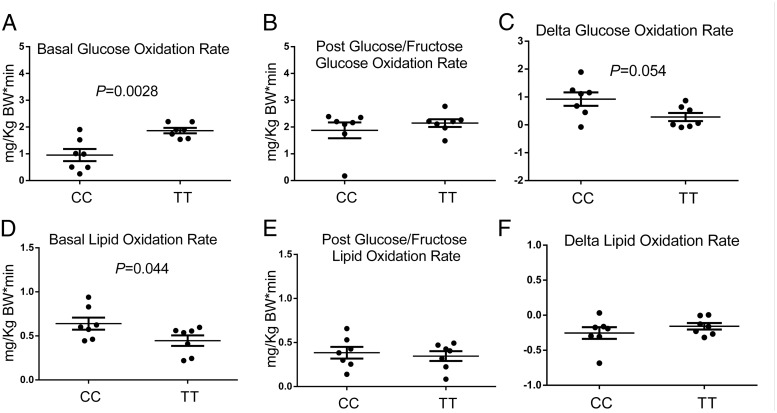
Figure 5.
Rates of glucose and lipid oxidation during the study. Values are expressed as mean ± SEM. Upper panels describe the rates of glucose oxidation during the fasting state (A) and after the glucose/fructose load (B), as well as the absolute changes in the rates of glucose oxidation (C). In the lower panels are shown the fasting rates of lipid oxidation (D), the rates of lipid oxidation after the glucose/fructose load (E), and the change in rates of lipid oxidation (F). The groups were compared by a paired t test. P values are given only for statistically significant comparisons.

