
Figure 1.
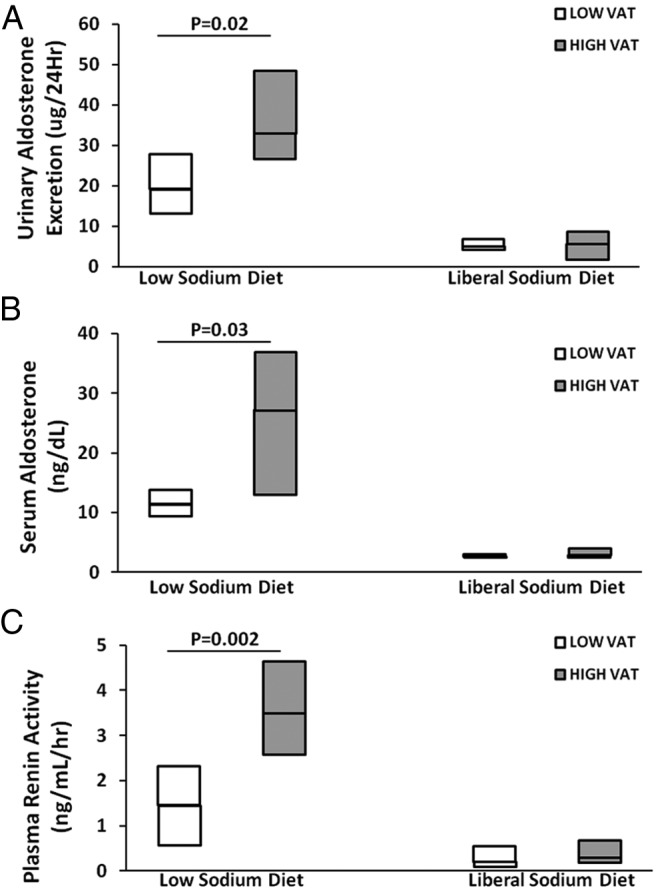
Comparison of RAAS parameters urinary aldosterone excretion (micrograms per 24 h) (A), serum aldosterone (nanograms per deciliter) (B), and PRA (nanograms per milliliter per hour) (C) during the low-sodium and liberal sodium diets in HIV-infected patients with low VAT vs high VAT.