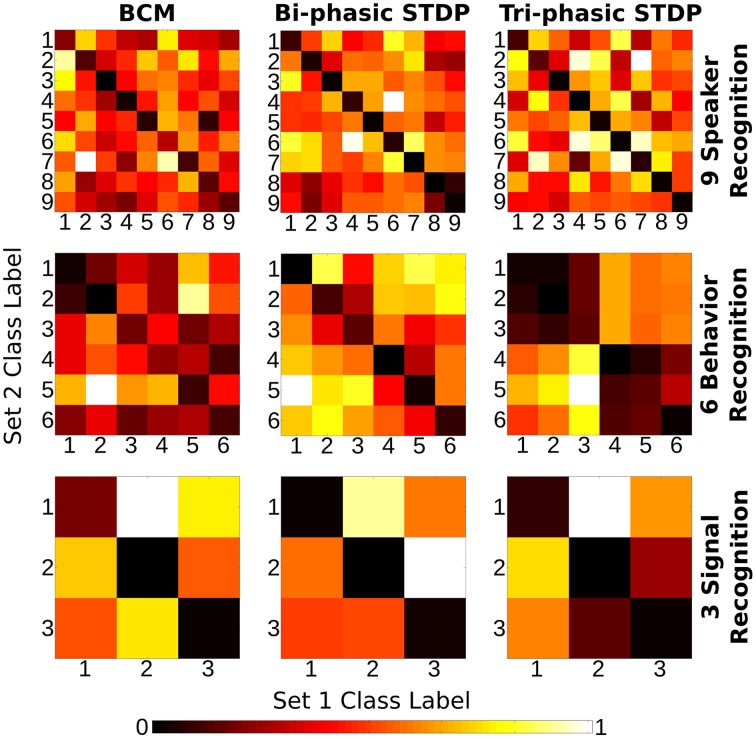
Figure 6.
Class correlation of structural synaptic adaptation. Heat map plots indicate the structure learned on each class for the three tasks under each of the plasticity rules. Essentially, it is a confusion matrix of the geometric distance between the weight matrix adaptation of each class of sample. The training data for each task is divided into two sets. Class-average adaptation is found for each set. There is then a distance calculated between each class of the two sets. Lower values on the descending diagonal indicate higher correlation within a class adaptation and therefore strong class-specific structure learned.

