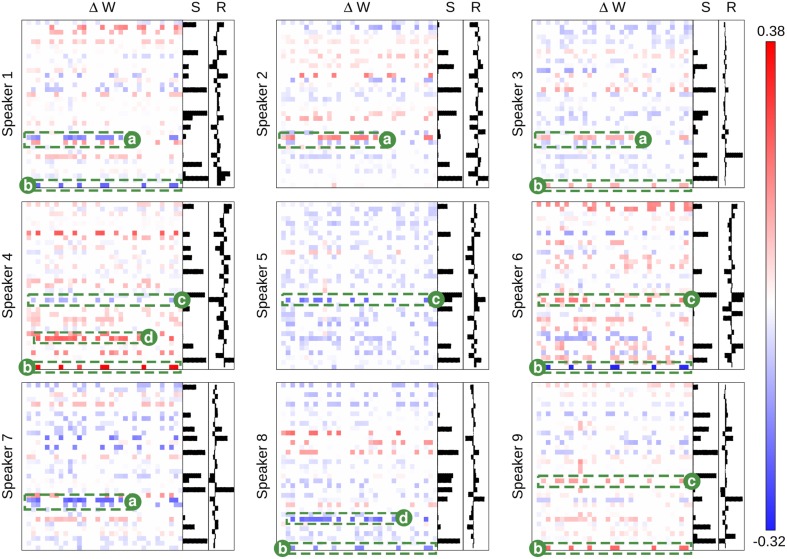
Figure 7.
The class-specific synaptic adaptation for the 9 class speaker recognition task under BCM plasticity. The main heat maps in each subplot show the adaptation of the weight matrix (synapses) after the presentation of voice input data from each speaker. Blue values show a reduction in synaptic strength and red values show an increase. Each N × N weight matrix has pre-neurons on the x-axis and post-neurons on the y-axis. The bar-chart, S, shows the average neuron activation for each class. The bar-chart,R, shows the learned readout weights. Labeled synapses a–d indicate key structural changes that are selective between different speakers. Each label alone can distinguish between two sets of speaker. Taken all together, the labeled synapses adapt specifically to each speaker in a unique pattern, learning a distinct network structure for each one.

