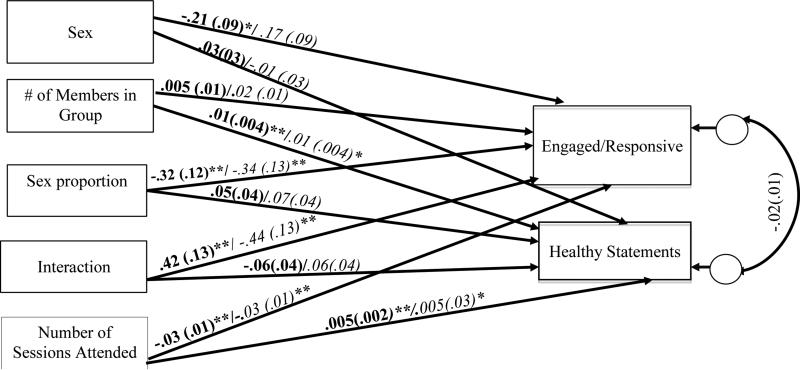
Figure 2.
Path model for the estimation of engagement/responsiveness and percentage of health promoting statements by sex, group composition, their interaction, including covariates (number of members in group; total number of sessions attended). Multi-level random effects not pictured here. The results for girls are in bold and the boys’ results are in italics. * p <. 05; ** p < .001.

