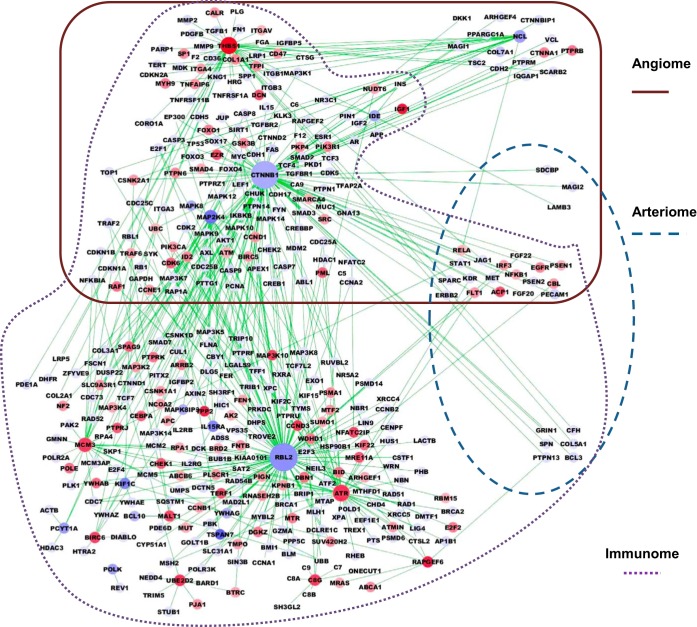
Fig. 5.
Subnetwork of PADPIN for C57BL/6 mouse data. PIN generated by the top 10 up- and top 10 downregulated genes in ischemic vs. nonischemic muscles in C57BL/6 mouse comprises 395 proteins and 428 interactions. The color of nodes from red to blue represents the gene expression level from high to low. The size of nodes from large to small represents the degree of nodes, i.e., the number of interactions, from high to low.

