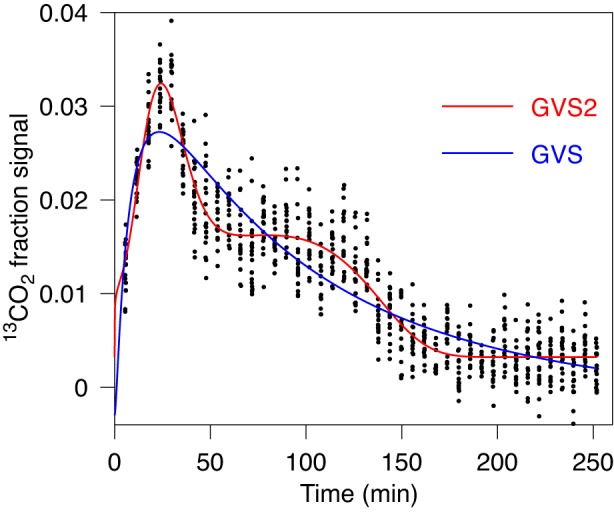
Fig. 6.

Fit of gastric emptying data by GVS (Eq. 1) and by GVS2 (Eq. 4) models. Data are consistent with 2 peaks, although 1 is barely observable at time 79 min, but the corresponding hump is clearly observed. Data are well described by fit obtained with GVS2 model. According to our criterion the first peak is not spurious. For characteristic parameters and AICc value see Table 1, case 4. There is essentially no difference in Tlag, but there is a noticeable difference in maximal rate. Also half times differ substantially; see Table 1.
