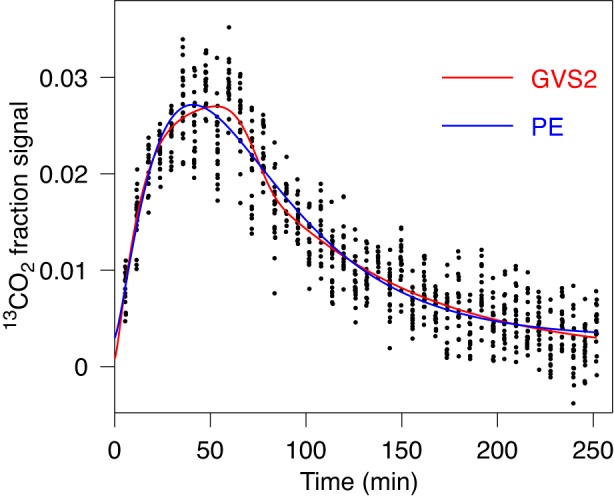
Fig. 8.

Fit of gastric emptying data by GVS (Eq. 1) and by GVS2 (Eq. 4) models. Data are consistent with 1 peak. The figure suggests that data are better described with GVS2 model then with PE, the 2nd best model by AICc. For characteristic parameters and AICc value see Table 1, case 6. The obvious difference is in the lag time.
