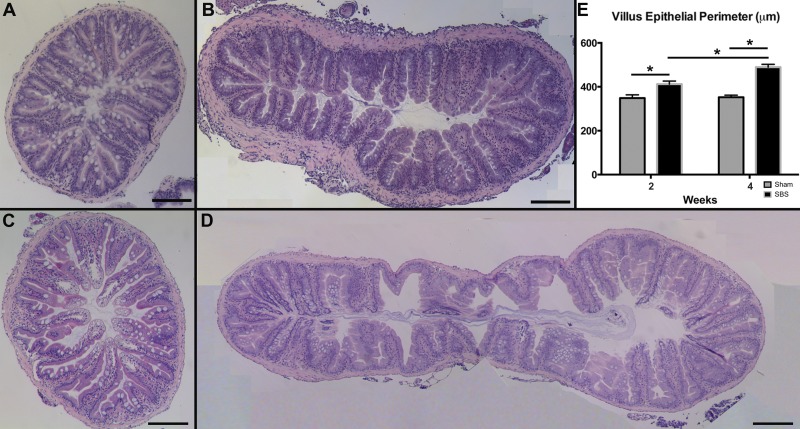
Fig. 3.
The villus epithelial perimeter is significantly increased in SBS fish, suggesting increased adaptation. The sham fish at 2 wk (A) and 4 wk (C) postoperatively vs. SBS fish at 2 wk (B) and 4 wk (D) postoperatively. S1 segments were harvested and stained with hematoxylin and eosin, and composite ×10 images were tiled for a complete cross section. E: quantification of villus epithelial perimeter (μm) of the sham and SBS groups at 2 and 4 wk. Results are reported as means ± SE. Scale bar = 200 μm. *P < 0.01.

