Fig. 5.
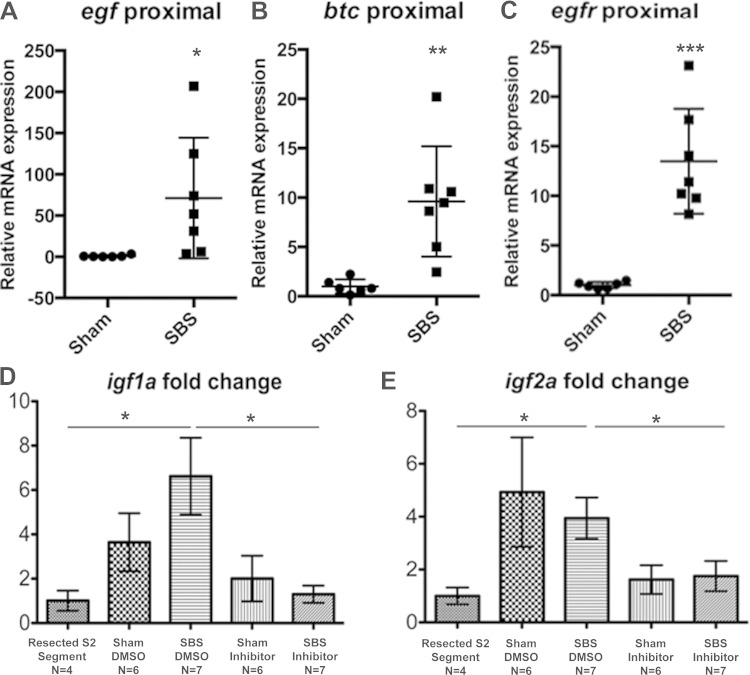
SBS fish show increased expression of adaptation-associated growth factor pathways. A–C: RNA from proximal intestinal segments of sham and SBS fish was subjected to RT-quantitative PCR (qPCR) analysis for egf, btc, and egfr. Each point represents 1 fish. D and E: RNA from sham and SBS fish treated with either DMSO vehicle or Igfr inhibitor was subjected to RT-qPCR analysis for igf1a and igf2a. Results reported as ratio of ef1a, housekeeping gene. Error bars indicate SE. *P < 0.05; **P < 0.01; ***P < 0.0001.

