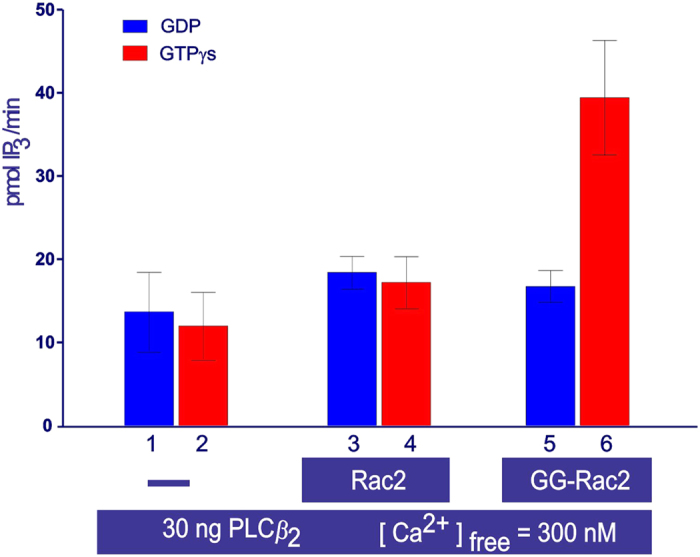
Figure 2. Activation of PLCβ2 by GTP bound prenylated Rac2 in the cell-free system.

The bar chart reports the average activity measured in duplicate samples (± the s.e.m.) upon sample incubation at 30 °C for 45 min. The samples contained: purified PLCβ2 (2–803 AA) (0.5 ng/μl, equivalent to 5.4 nM), DOPE: PtdIns (4,5)P2/[3H]-PtdIns (4,5)P2 lipid vesicles 16:1 mol/mol, 300 nM free calcium, 100 μM GDP (blue bars), 100 μM GTPγS (red bars), and 1.6 ng/μl GG-Rac2.
