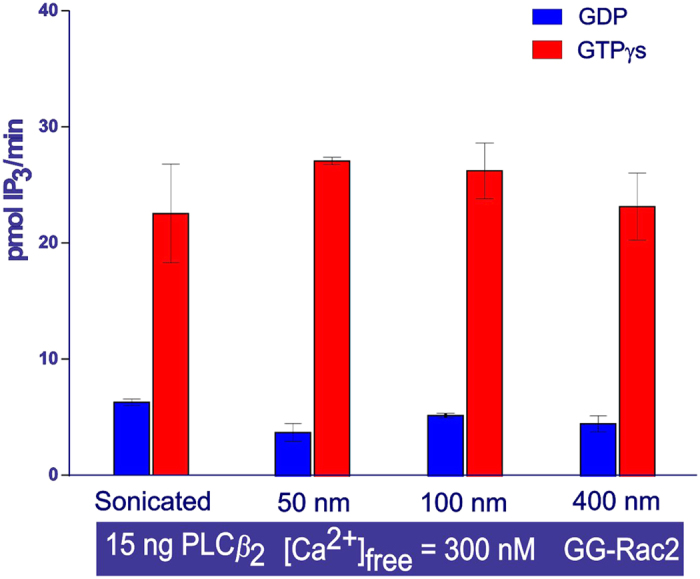
Figure 4. The effect on PLCβ2 activity of lipid bilayer curvature.

The bar chart shows the average activity measured in duplicate samples (± the s.e.m.). The activity was monitored using the cell-free system and with lipid vesicles of different sizes. The lipid vesicles were prepared by extrusion using various pore size filters (50, 100, 400 nm) or by sonication. The samples contained: purified PLCβ2 (0.25 ng/μl, equivalent to 2.7 nM). All other conditions are the same as for Fig. 2.
