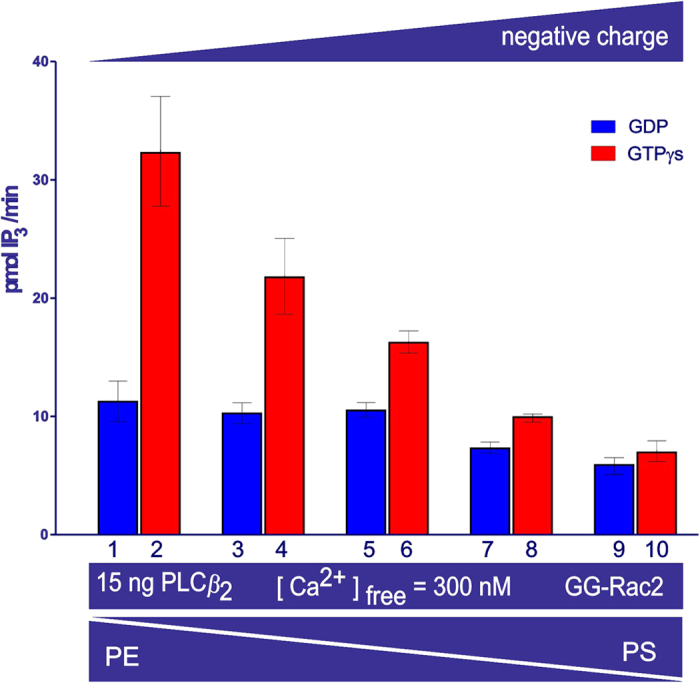
Figure 5. The effect on PLCβ2 activity of negatively charged lipid vesicles.

The bar chart shows the average activity measured in duplicate samples (± the s.e.m.). The lipid vesicles have the following DOPE: DOPS ratios: 16:0 (columns 1 & 2), 11.2:4.4 (columns 3 & 4), 8.0:7.3 (columns 5 & 6), 4.8:10.3 (columns 7 & 8) and 0:16 (columns 9 & 10) mol/mol. The proportion of PtdIns (4,5)P2 substrate in the vesicles was constant at (DOPE + DOPS): PtdIns (4,5)P2/[3H]-PtdIns (4,5)P2 16:1 mol/mol. All other conditions are the same as for Fig. 2.
