
Figure 4. Number of Fusarium oxysporus f. sp. cubense (FOC) colony forming units (CFU) of disease-suppressive (CKH) and diseased (CKD) samples in the control treatment and healthy (BIOH) and diseased (BIOD) samples within the bioorganic fertilizer treatment.
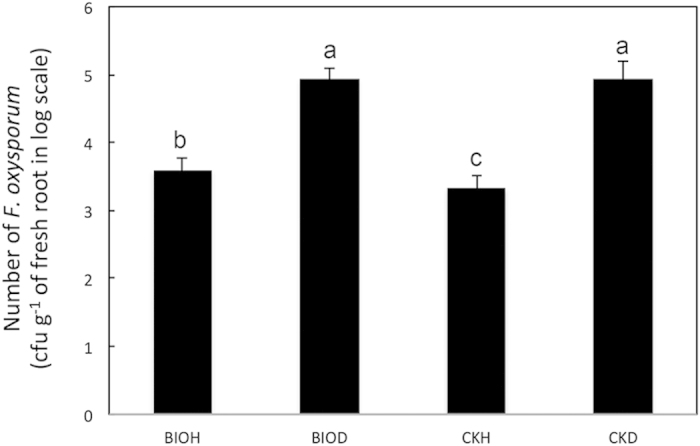
The significance of the difference was determined by one-way ANOVA (n = 4). Bars shared the same character represent a lack of significant difference (p > 0.05).