
Figure 5. Non-metric multidimensional scaling analysis based on Bray-Curtis dissimilarity between all sample sets.
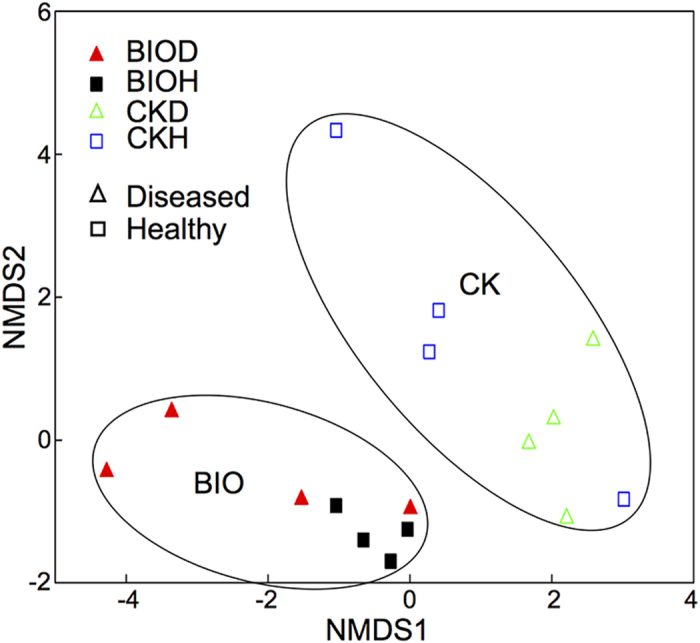
CKH and CKD are healthy and diseased samples collected in control treatment, respectively. BIOH and BIOD are healthy and diseased samples collected in bioorganic fertilizer treatment, respectively. BIO and CK are samples collected in bioorganic fertilizer and control treatments, respectively, regardless of plant health status.