
Figure 6. Multiple regression tree (MRT) analysis of plant health status and treatment effects on microbial composition.
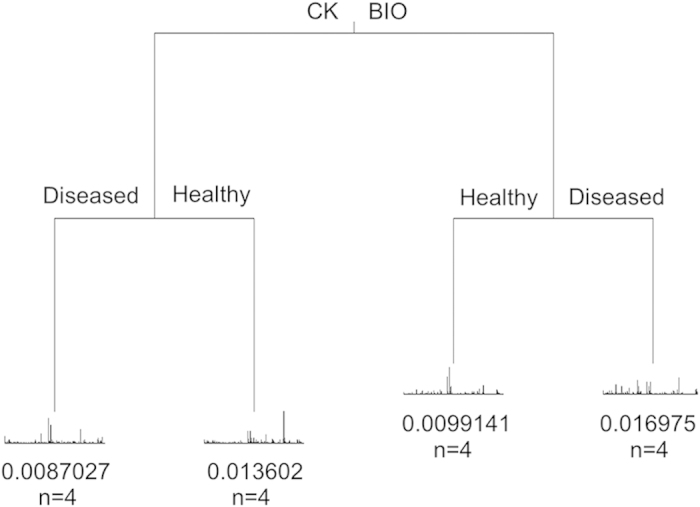
BIO and CK represent bioorganic fertilizer and control treatments, respectively.
Official websites use .gov
A
.gov website belongs to an official
government organization in the United States.
Secure .gov websites use HTTPS
A lock (
) or https:// means you've safely
connected to the .gov website. Share sensitive
information only on official, secure websites.
BIO and CK represent bioorganic fertilizer and control treatments, respectively.