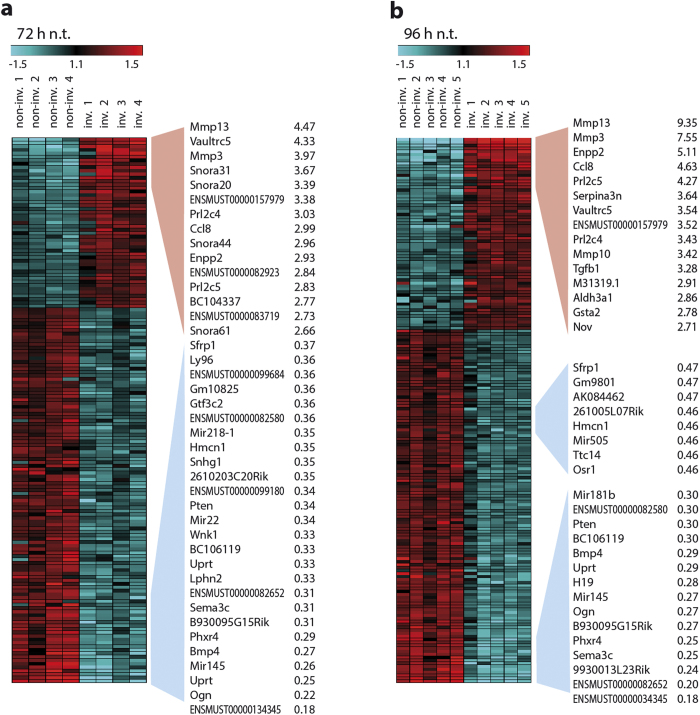
Figure 2. Transcriptome analysis (Affymetrix mouse gene ST 1.0 array) of fibroblast invasion.
Separation and cell-lysis of MLg fibroblasts was performed 72 (a) and 96 hours (b) after plating the cells on top of the 3D collagen matrix. The displayed heatmaps show the top significantly up-, and down-regulated genes (>2-fold) that were found in the microarray analyses. Low and high expressed targets in the heatmap are depicted in blue and red, respectively. Each column represents one independent experiment. (n.t. = non-treated; non-inv. = non-invading fibroblasts; inv. = invading fibroblasts).

