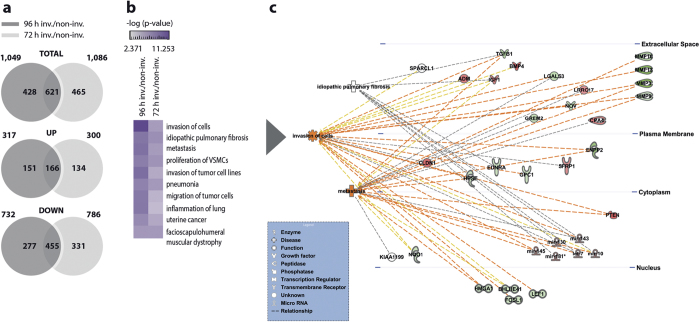
Figure 3. A time-dependent gene expression overlap of the conducted microarrays at 72 and 96 hours and predictive in silico analysis.
Venn diagrams depict the expression overlap in deregulated genes (>1.5x) comparing the expression ratios of invading (inv.) and non-invading (non-inv.) fibroblasts at 96 hours and 72 hours after invasion. Note, 621 targets were found to overlap which comprise 166 up- and 455 down-regulated genes (a). An IPA generated heatmap that shows the ten most significantly over-represented ‘disease processes’ and ‘biological functions’ including ‘invasion of cells’, ‘idiopathic pulmonary fibrosis’, and ‘metastasis’ (b). Causal network analysis of underlying pathways of ‘invasion of cells’, ‘idiopathic pulmonary fibrosis’, and ‘metastasis’. Targets that were significantly up-, or down-regulated in the invading fibroblast phenotype are represented in green and red, respectively. The dashed orange lines illustrate activating relationships, yellow lines point out findings that are inconsistent with the state of downstream molecules, and grey lines indicate that the mode of effect is not defined (c).

