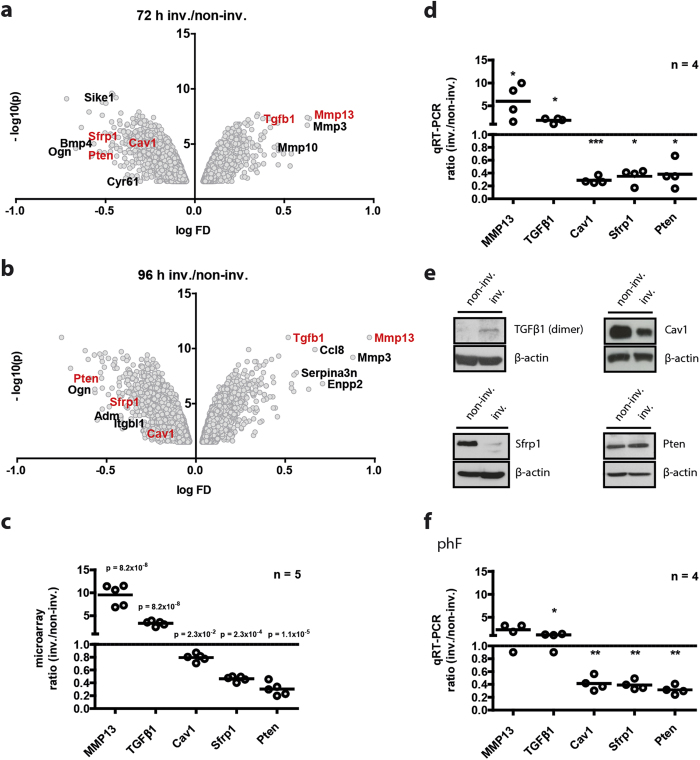
Figure 4. Expression levels of selected genes from the microarray analyses and validation by qRT-PCR and immunoblotting.
Volcano plots depict the significantly differentially regulated probesets in the invading fraction at 72 (a) and 96 hours (b) time-points. Targets, used for microarray verification by qRT-PCR are highlighted in red. Here, the expression ratios derived from the microarray data are shown for a selected group of genes reportedly known to be functionally involved in the invasion of cells. The graph depicts the up-regulated targets in the invading fraction that is MMP13 (9.5x) and TGFβ1 (3.3x), as well as the down-regulated targets Cav1 (0.8x), Pten (0.3x) and Sfrp1 (0.5x) (n = 5). Data are shown with Benjamini-Hochberg (BH)-adjusted p-values. Genewise testing for differential expression employed the limma t-test and Benjamini-Hochberg multiple testing correction (FDR < 10%) (c). qRT-PCR analyses confirming the differential expression of a selected group of genes (MMP13, TGFβ1, Cav1, and Pten) with the differential expression data derived from the microarrays. The data represent the fold induction values of the ratio between invading and non-invading fibroblasts. Data are shown as mean values from four independent experiments (n = 4). Statistical analysis: paired t-test. *p < 0.05 and ***p < 0.001 (d). Representative immunoblots of TGFβ1, Cav1, Sfrp1 and Pten in invading (inv.) and non-invading (non-inv.) mouse lung fibroblasts on protein level. Immunoblots were cropped to improve clarity. Uncut blots are depicted in supplementary Fig. S2 (e) in invading (inv.) and non-invading (non-inv.) mouse lung fibroblasts. qRT-PCR analyses in inv. primary human fibroblasts (phF) reveals a similar deregulation of MMP13, TGFβ1, Cav1, Sfrp1 and Pten as found in the MLg fibroblasts (f). Data shown represent mean values from four independent experiments (n = 4). Statistical analysis: paired t-test. *p < 0.05 and **p < 0.01.

