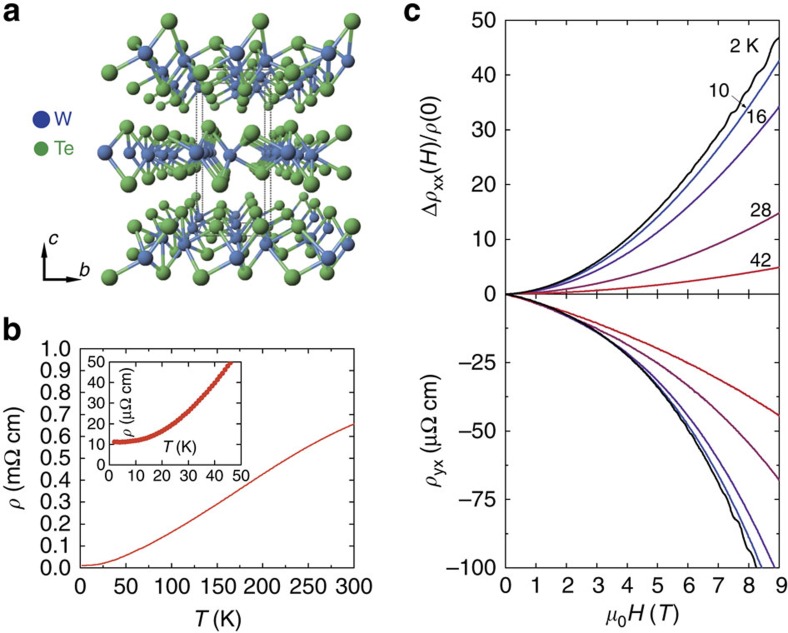
Figure 1. WTe2 transport measurements at ambient pressure.
(a) The atomic structure of the WTe2 crystal. Blue and green circles represent W and Te, respectively. (b) Temperature dependence of electrical resistivity at ambient pressure. The inset shows detail of data below 50 K with no hint of any superconductivity. (c) The magnetoresistance (upper plot) and Hall resistivity (down plot) at different temperatures at ambient pressure. Different colours represent different temperatures as marked.

