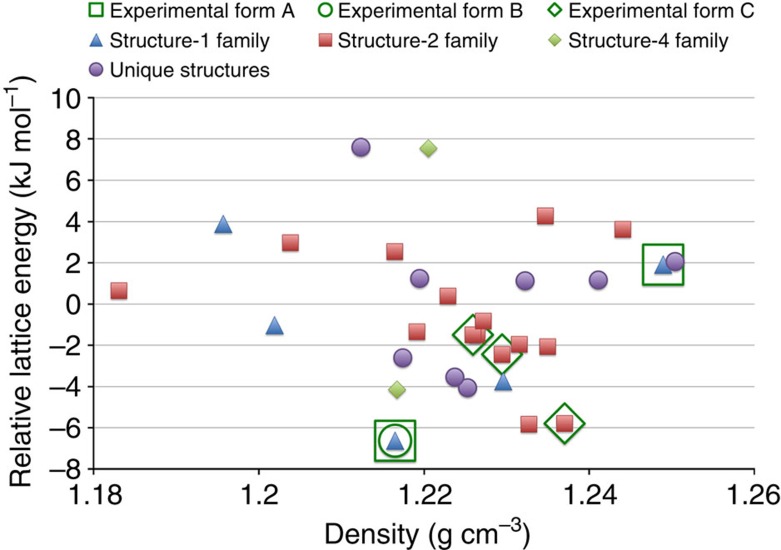
Figure 2. Energy-density diagram generated from the crystal structure prediction of Dalcetrapib.
Energy-density diagram for the 30 computer-generated and three experimentally observed crystal structures of Dalcetrapib. Two of the experimental crystal forms are disordered and match several similar computer-generated structures. The computer-generated structures are numbered 1–30 in order of increasing lattice energy and families of similar structures are named according to their member with the lowest lattice energy. The average lattice energy was calibrated to zero.

