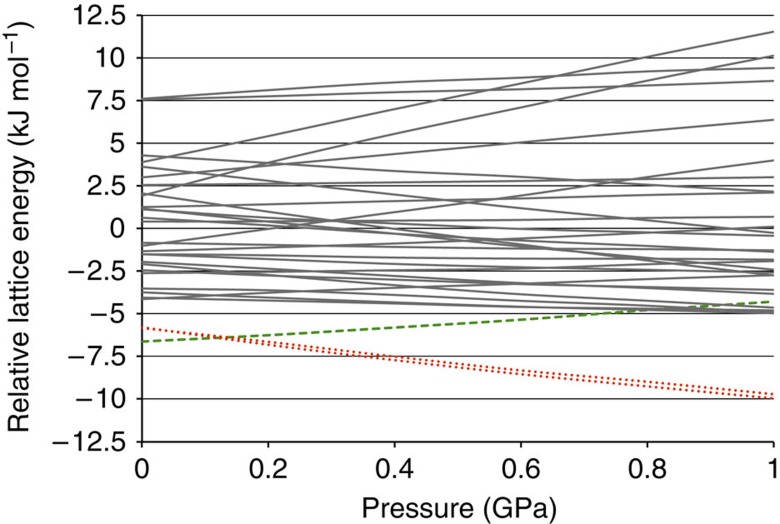
Figure 4. Relative lattice energies as a function of pressure.
Relative lattice energies as a function of pressure for computer-generated structure 1 (green dashed line), structures 2 and 3 (red dotted lines) and all other computer-generated structures (continuous grey lines) of Dalcetrapib. Lattice energy optimizations were carried out from 0.0 to 1.0 GPa in steps of 0.2 GPa. For every pressure the average lattice energy was calibrated to zero.

