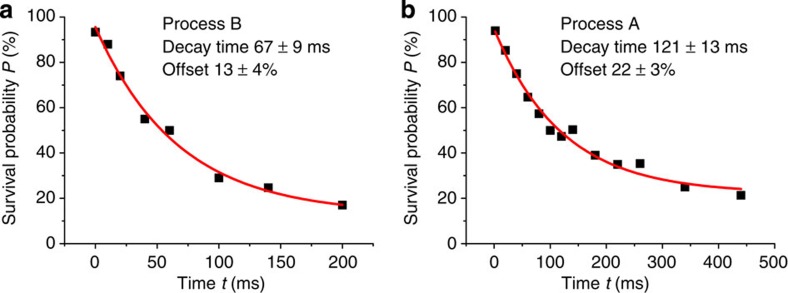
Figure 3. The decay under different conditions.
(a,b) Survival probability P versus time t for the B and A collisions, respectively. The black squares are experimental data collected at the trap depth U0=0.6 mK, with each point being the result from 300 repeated measurements. The solid curves show a fit by the formula P=w exp(−t/τ)+w0, and the error in the decay time indicates the s.d. when using the fit of P(t) by the exponential formula. In (a) The measurements are done for the survival probability of 85Rb after kicking out 87Rb, and the initial temperatures are T87=35±3 μK and T85=15±1 μK. In (b) 85Rb is kicked out, and the survival probability of 87Rb is measured with the initial temperatures T87=47±3 μK and T85=27±2 μK.

