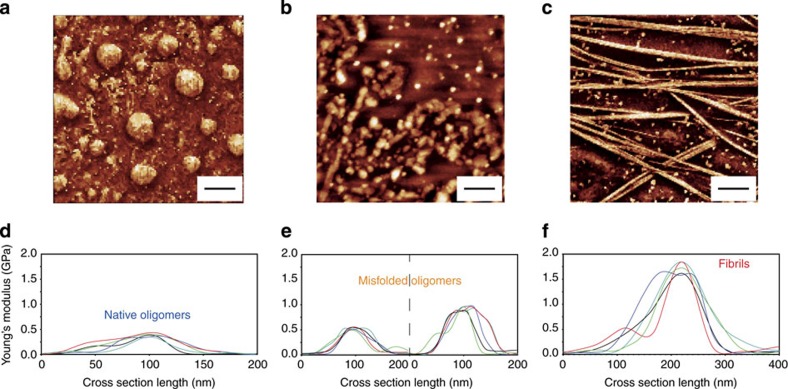
Figure 2. Young's modulus increases as a function of aggregation.
AFM quantitative imaging of: (a) oligomeric proteins at 0 day, (b) oligomers after 2 days and (c) fibrillar structures after 7 days of incubation at 37 °C. Scale bar, 2 μm. Stiffness cross-sections of (d) oligomers at 0 day, (e) oligomers at 2 days and (f) fibrillar structures.

