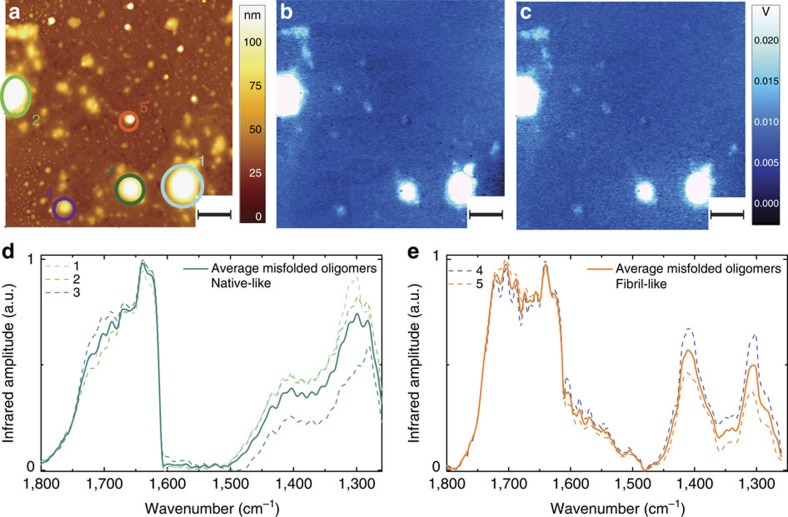
Figure 4. AFM-infrared chemical maps and spectra after 2-day incubation.
(a) AFM height image. Infrared absorption in amide I (b) and at (c) 1,700 cm−1 and (d) 1,655 cm−1. Scale bar, 2 μm. (d) Spectra of misfolded oligomers, which are native-like with amide I similar to the monomeric structures. (e) Spectra of misfolded oligomers, fibril-like showing a conformational switch towards β-sheet structure.

