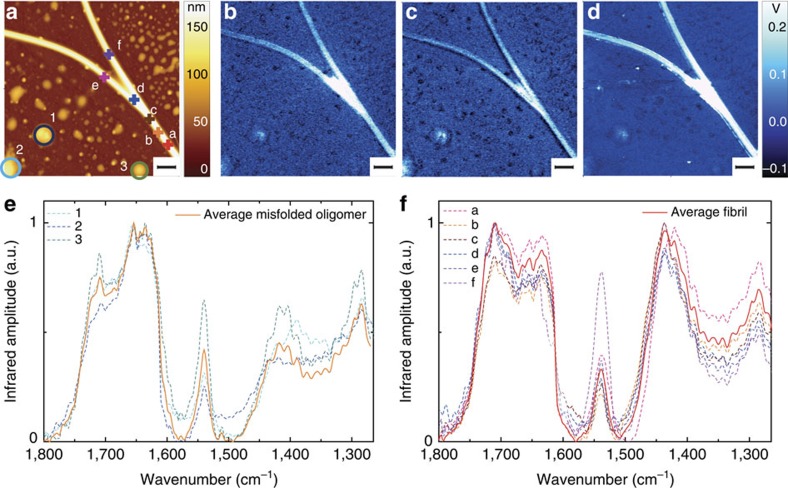
Figure 5. AFM-infrared chemical maps and spectra of fibrils and oligomers after 7-day incubation.
(a) AFM height. Infrared absorption at (b) 1,700 cm−1 (amide I), (c) 1,655 cm−1 (amide I) and (d) 1,430 cm−1. Scale bar, 1 μm. Spectra of amyloid structures: (e) misfolded oligomer (labelled 1, 2 and 3 in a) and (f) fibrils (labelled a–f in a).

