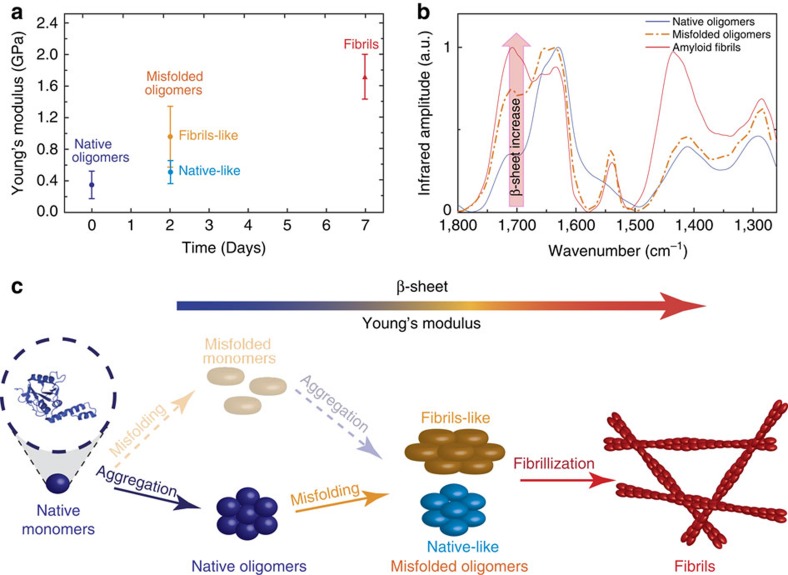
Figure 7. Model of the link between nanomechanical and structural properties.
(a) The increase in the Young's modulus as a function of fibrillization maturity (the error bars are defined as the s.d. of the distribution of the stiffness values of the aggregates). (b) Spectra of native oligomers at 0 day (blue), misfolded oligomers at 2 days (orange and light blue) and amyloid fibrils at 7 days (red). The red arrow indicates the increase in the content of β-sheet secondary structure. (c) Model of the possible pathways of Josephin aggregation: the transparent model refers to the generally accepted model ‘first-misfolding-then-aggregation', while the solid one to the new suggested model of ‘first-aggregation-then-misfolding'.

