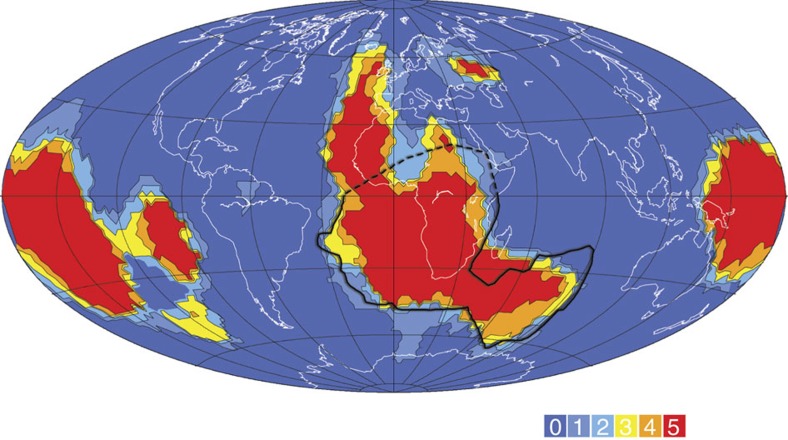
Figure 4. Vote map of cluster analysis of shear wave profiles.
(1,000–2,800 km depth). Map from ref. 31 shown with the edge of African LLSVP at CMB from refs 27, 28. The cluster analyses evaluate five global tomographic models32,33,34,35,36, with the colour-coded voting map representing the number of models, which assign a lower than average shear wave velocity to the pixel. The average spacing of the pixels is 4°. The voting map highlights the consistency between the global models in defining the African LLSVP, as well as the similar, but more spatially complex, Pacific LLSVP. Because of the inherent averaging in the cluster analyses, the voting map should not be used to comment on the sharpness of the African anomaly, which is better constrained by regional dense data coverage such as that used in refs 27, 28.

