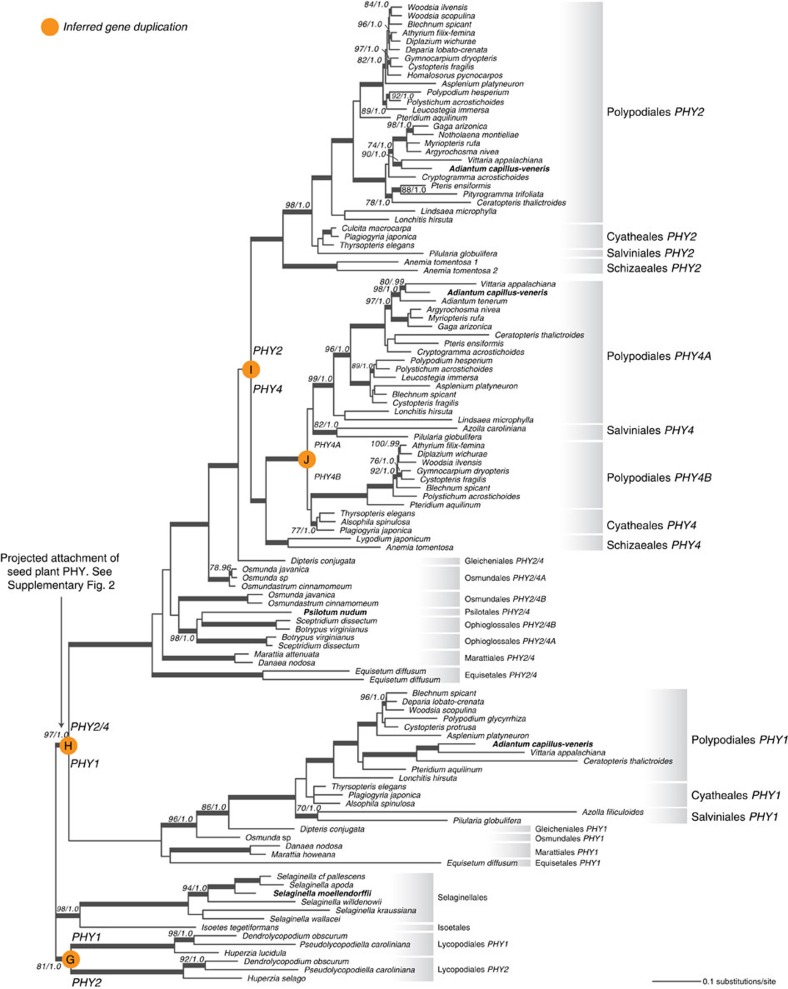
Figure 5. Phylogeny of fern and lycophyte phytochromes.
Previously identified phytochromes are shown in bold. Support values associated with branches are maximum likelihood bootstrap values (BS)/Bayesian posterior probabilities (PP); these are only displayed (along with thickened branches) if BS>70 and PP>0.95. Thickened branches without numbers are 100/1.0. The position of orange circles estimates the origin of inferred gene duplications. Italicized capital letters within each circle correspond to the duplication event mentioned in the text, and the numbers/letters adjacent to each circle indicate the names of the gene duplicates.

