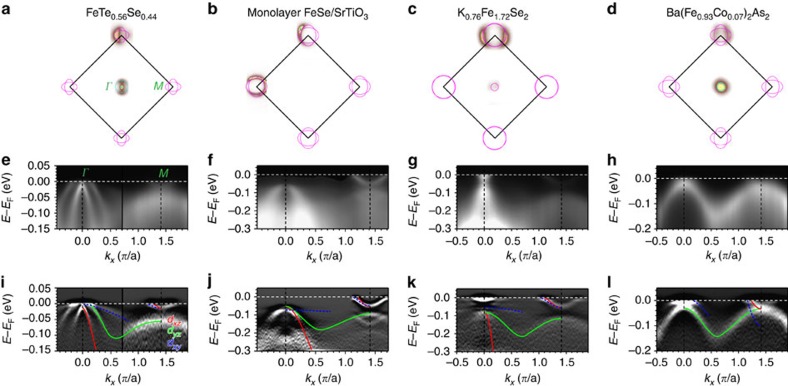
Figure 1. Low-temperature band structure of iron chalcogenides in comparison to iron pnictide.
Fermi surfaces measured on (a) FeTe0.56Se0.44 (FTS), (b) monolayer FeSe film on SrTiO3 (FS/STO), (c) K0.76Fe1.72Se2 (KFS) and (d) Ba(Fe0.93Co0.07)2As2 (BFCA), shown in BZ notation corresponding to 2-Fe unit cell (For comparison purposes, we use the M point to denote the BZ corner where the electron pockets live for all compounds and LDA, even though for 122 crystal structures, this is the X point.), with schematic outlines shown in cyan (magenta) for hole (electron) Fermi pockets. (e) Spectral image of FTS along the Γ–M high-symmetry direction, taken with 22 eV (26 eV) photons for near the Γ (M) point. Measurements along the same cut for (f) FS/STO, (g) KFS and (h) BFCA, with photon energies of 22, 26 and 47.5 eV, respectively. In-plane polarization was odd with respect to the cut for all measurements, (e–g) has additional out-of-plane polarization. (i–l) Second energy derivatives for the spectral images above. Observable bands are marked with dominant orbital character (red: dxz, green: dyz and blue: dxy).

