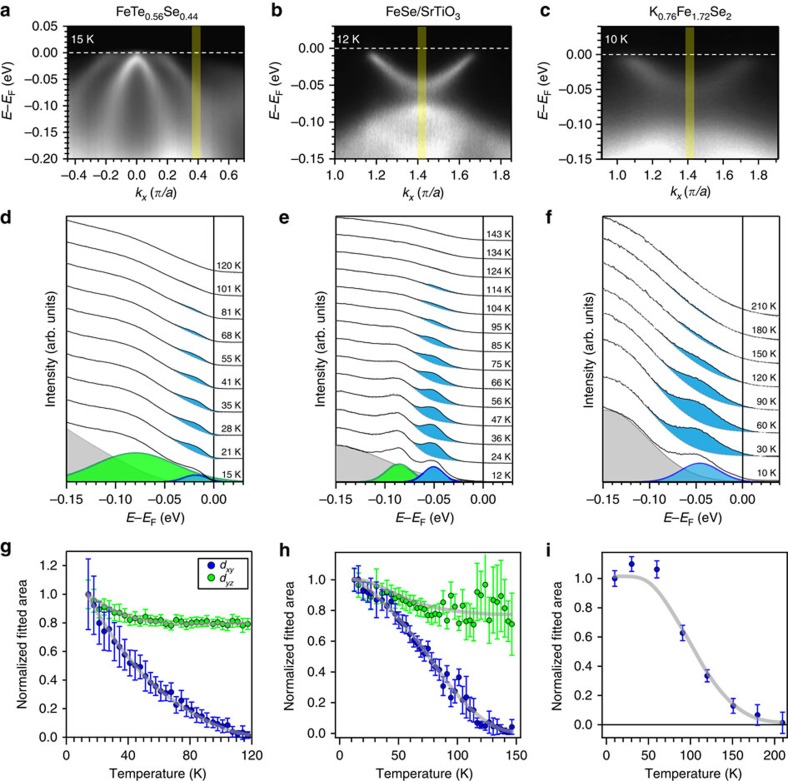
Figure 5. Quantitative analysis of temperature evolution in the iron chalcogenides.
(a–c) Raw spectral images of FTS, FS/STO and KFS taken in the low-temperature state. Yellow regions mark the momentum ranges integrated for energy distribution curve (EDC) analysis for each compound. (d) Integrated EDCs in the yellow region of a for FTS at selected temperatures, fitted by a Shirley background (grey), a Gaussian for the dxy band (blue), and a Gaussian for the dyz band (green), convolved by the Fermi–Dirac function. (e) Integrated EDCs in the yellow region of b for FS/STO at selected temperatures, with a Gaussian background (grey), a Gaussian for the dxy band (blue) and a Gaussian for the dyz band (green). (f) Integrated EDCs in the yellow region of c for KFS at selected temperatures, fitted by a Gaussian background (grey), and a Gaussian for the dxy band (blue). Residual spectral weight for the dxy peak is shaded for each temperature for all compounds. Fitted peaks for the lowest temperature are shown for each compound. (g–i) Temperature dependence of the fitted areas of the dxy and dyz peaks for FTS, FS/STO and KFS. Guides to eye are drawn in grey to show the trends. All curves are normalized by the initial value of the peak area. The error bars in g–i are error bars resulted from the fitting.

