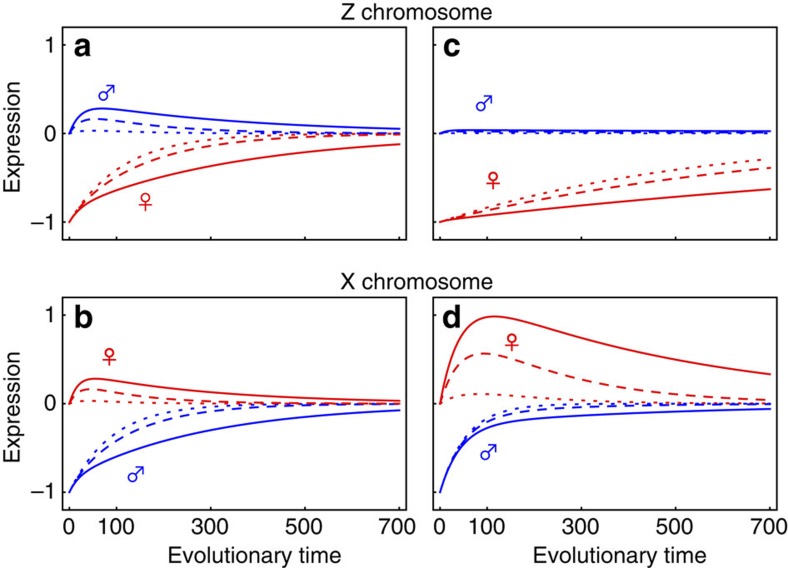
Figure 1. The evolution of dosage compensation on Z and X chromosomes.
Expected gene expression is shown for males (blue) and females (red) under a very low (ρ=0.1, dotted line), intermediate (ρ=0.5, dashed line) and strong inter-sexual correlation (ρ=0.8, solid line)—(see equations (13) and (14) for dynamics). a,b show equal selection in males and females (Sm=Sf=0.5); c,d show stronger selection in males (Sm=1, Sf=0.1). Evolutionary time refers to the number of generations, ignoring the time taken by successive mutations to fix. Expression is scaled according to the initial degradation z0 of expression in the heterogametic sex due to the loss of one gene copy, which here is set at z0=1. Other parameters were also held equal across the two sex chromosome systems (NeX=NeZ=1125, μ=0.0003).

