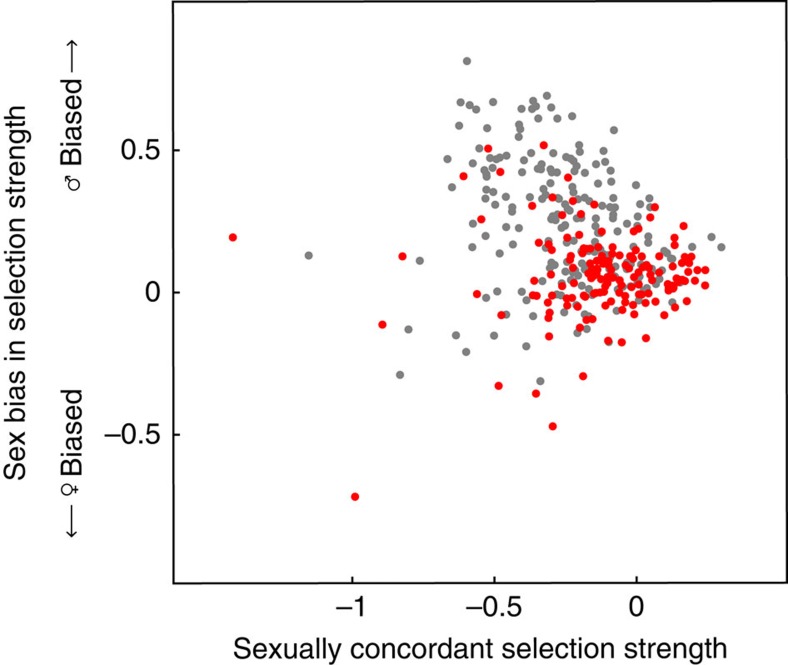
Figure 3. Selection on gene expression and dosage compensation in the chicken liver.
The figure shows the strength of sexually concordant selection and the measure of male bias in selection strength for liver-expressed genes used in our analysis. Dosage compensated genes (0.8<male-to-female expression ratio<1.2) are shown in red, and non-dosage compensated genes are shown in grey.

