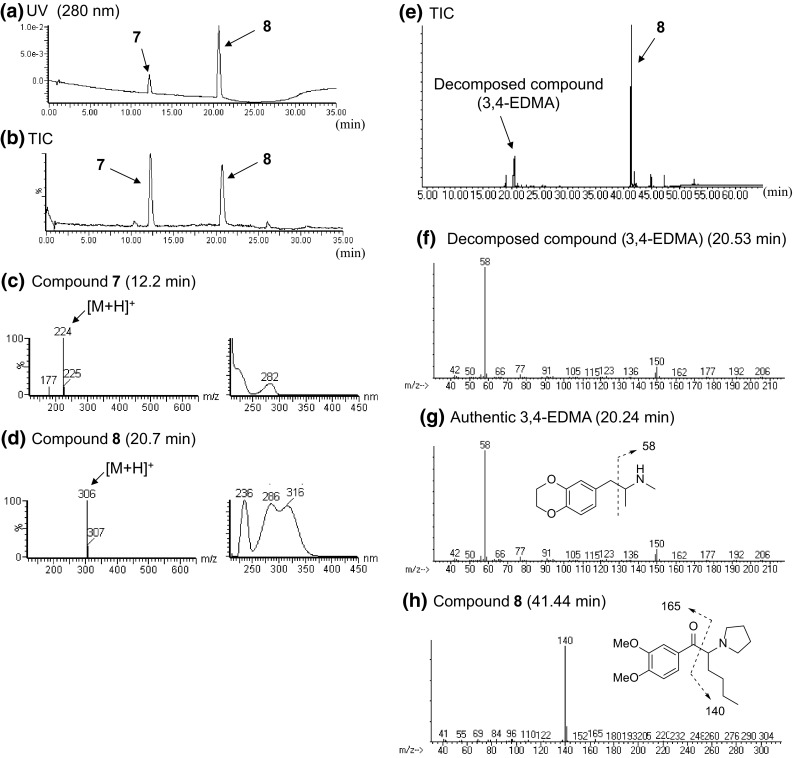
Fig. 10.

LC–MS and GC–MS analyses of product E. The LC–UV-PDA chromatogram (a), TIC (b), ESI mass and UV spectra of peaks 7 (c) and 8 (d) are shown. TIC (e) and EI mass spectra of peaks of decomposed compound [3,4-ethylenedioxy-N-methylamphetamine (3,4-EDMA)] (f), compound 8 (h) and the authentic 3,4-EDMA (g) obtained by GC–MS analysis are also presented
