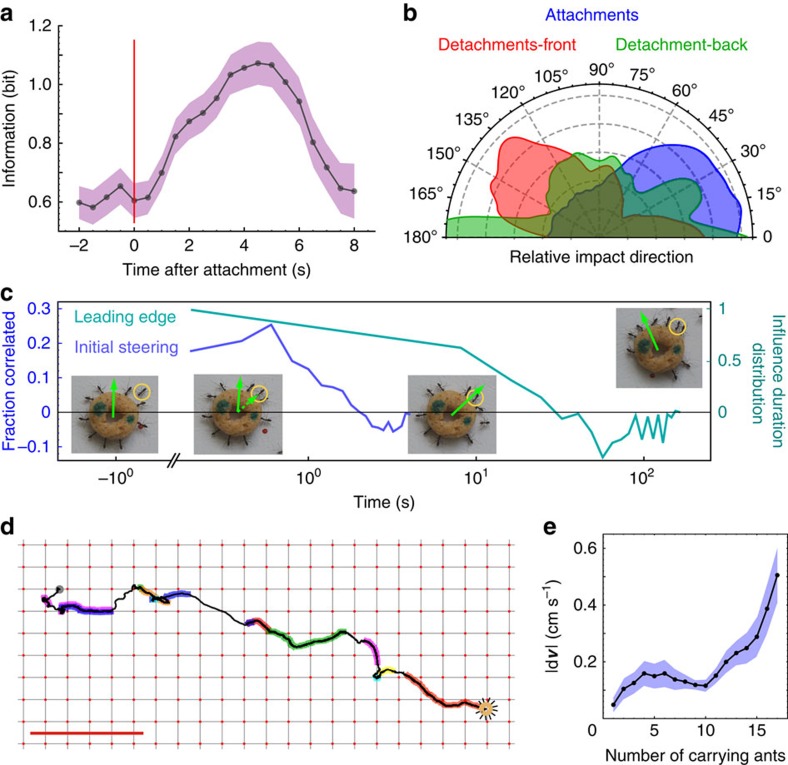
Figure 2. Transient guidance.
(a) The information in the angular spread of the load's direction of motion immediately following the attachment of a new ant at t=0 (N=134 attachments). Errors were calculated from the entropy of artificially generated histograms with added binomial noise. (b) A half-polar histogram of the angles between the attachment/detachment point of an ant and the change in velocity (relative impact direction) that follows different events (N=252). (c) Relative impact direction as a function of time (blue line N=134 attachments) and difference between distributions of time since attachment of ants in the leading and trailing edge of the load (turquoise line). The insets illustrate this process for a sample newly attached ant (marked by a yellow circle). Load velocity (green arrow) and the acceleration caused by this ant (dashed arrow) are overlaid. (d) An example of a series of switches between steering ants along a trajectory. Overlaid colours mark trajectory segments where different ants steered the load. Scale bar, 10 cm. e) Mean magnitude of velocity change caused by newly attached ants (denoted by  on y axis) as a function of number of ants already attached (N=134 attachments). Error bars are standard error of the mean.

