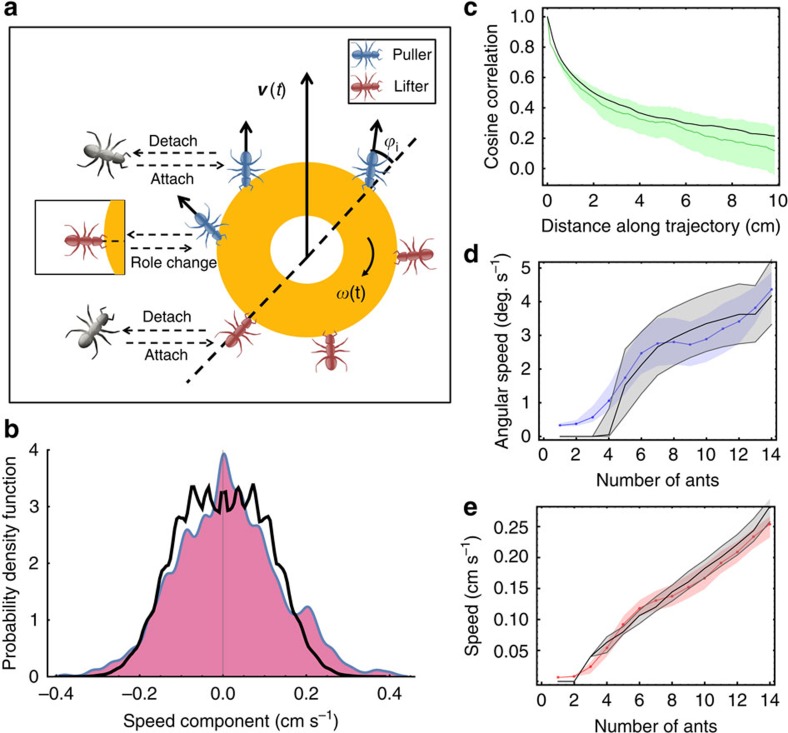
Figure 3. Microscopic model.
(a) Model sketch including the possible transitions for non-informed individual ants. (b–e) The four model parameters were set by fitting experimental data of b. The distribution of the object's velocity (projected on an arbitrary direction) in periods of continuous motion (N=56,030 frames). (c) Correlation distance functions (N=17 trajectories). (d) Median speed (N=56,030 frames). (e) Median angular speed (N=56,030 frames). In each of these panels, the coloured lines represent the experimental data for ants transporting a load in the absence of informed ants. The solid black lines denote the results of our model. Error bars in c are the maxima and minima of correlation functions produced by partitioning the data into four parts. Error bars in d and e are the s.d. of a distribution of medians calculated for 1,000 samples bootstrapped from the data.

