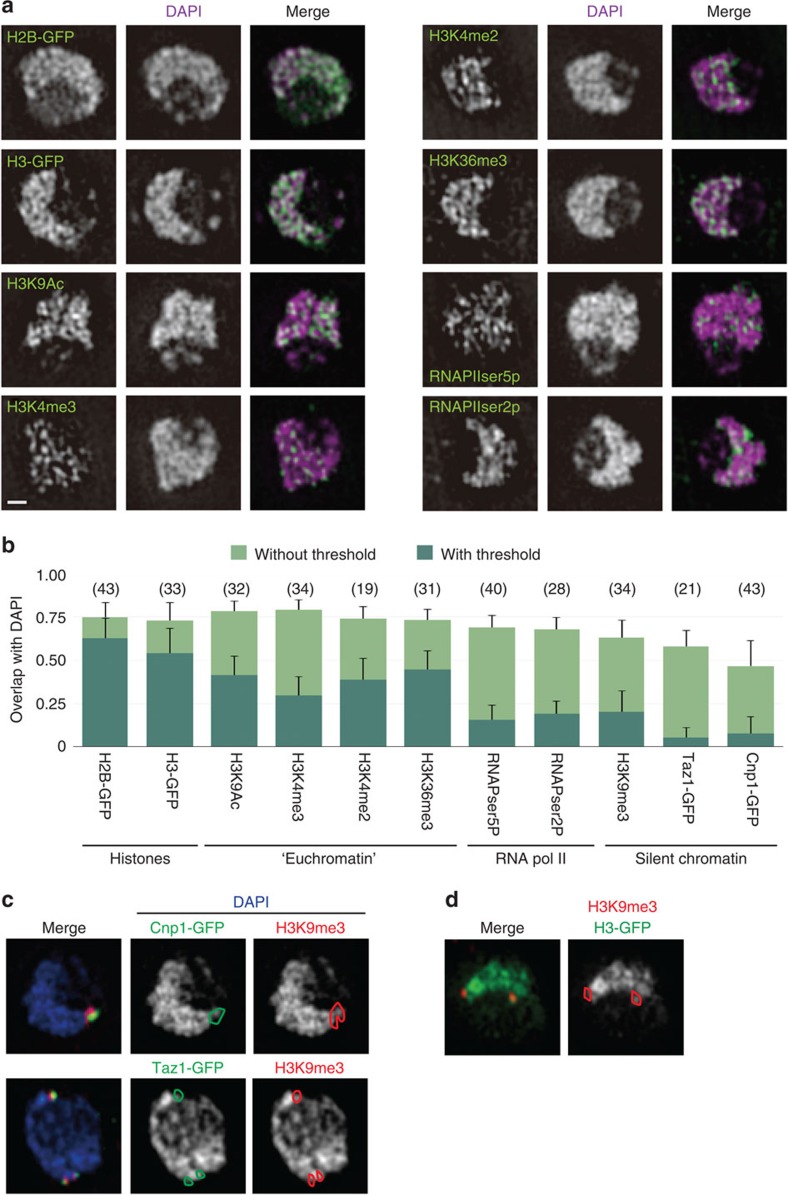
Figure 2. DNA concentration in the interphase nucleus of S. pombe.
(a) Single optical sections obtained with 3DSIM of fixed, immunostained nuclei using antibodies recognizing the indicated epitopes (green) and counterstained with DAPI (magenta). ‘RNAPIIser5p' and ‘RNAPIIser2p' denote RNAPII phosphorylated at serine 5 and 2 of the C-terminal domain, respectively. Scale bar, 500 nm. (b) Quantitative representation of the overlap of each chromatin marker with DAPI staining. Bar shows s.d. of nuclei. The value 1.0 indicates perfect overlap of the immunofluorescence with the DAPI fluorescence. Numbers in parenthesis indicate the number of nuclei examined. (c) The merged images (left panels) show centromeric (Cnp1-GFP) and telomeric (Taz1-GFP) regions in green and silent loci marked by trimethylation at lysine 9 of histone H3 (H3K9me3) in red, superimposed on DAPI images in blue. The right two columns show the corresponding DAPI images (white) marked with regions of Cnp1-GFP or Taz1-GFP (the green contour) and H3K9me3 regions (the red contour). (d) The merged image (left panel) shows H3K9me3 (red) superimposed on the image of histone H3-GFP (green); the right panel shows the corresponding histone H3-GFP image (white) marked with the H3K9me3 region (the red contour).

