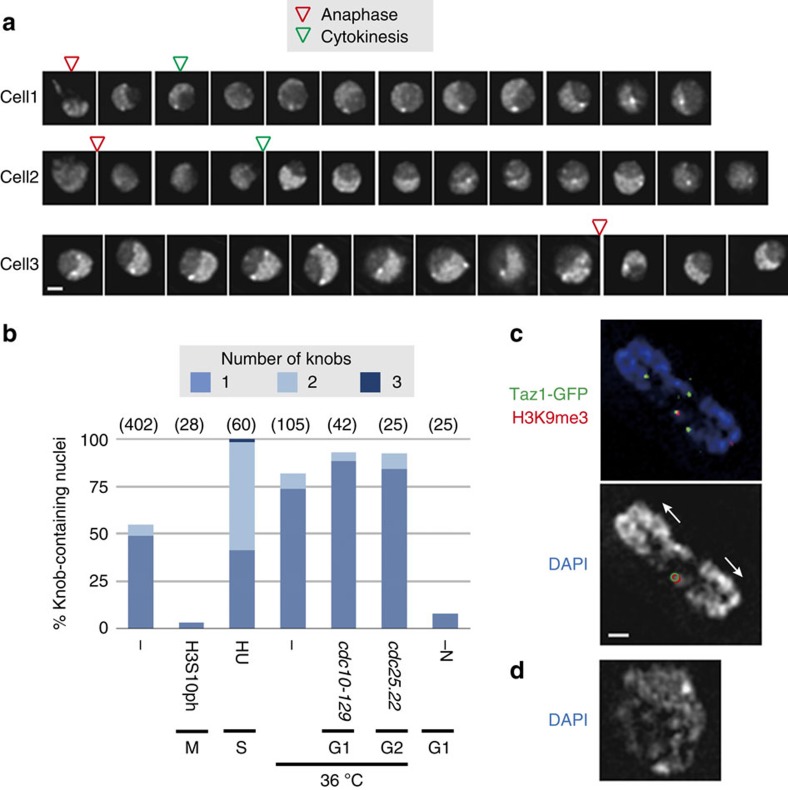
Figure 5. Knob condensation is dynamically regulated in the cell cycle.
(a) Live imaging of three independent cells expressing H2B-GFP. Pictures were taken every 7.5 min but here images are shown in 15-min steps. Deconvolved optical sections with the brightest dots at each time frame are shown. Scale bar, 1 μm. (b) Frequency of knob-containing nuclei. The number of knobs in a nucleus is indicated by different colours. Standard growth conditions (wild type in EMM2 5S at 26 °C) are indicated as ‘−' and any differences from these conditions are indicated. ‘H3S10ph' means standard cells positively stained with anti-H3S10ph antibody, which is specific for the M phase. Cell cycle was arrested with hydroxyurea (‘HU'), temperature-sensitive mutations or nitrogen starvation (‘-N') at S, G1 or G2. Numbers in parenthesis indicate the number of nuclei examined. (c) An optical section of a typical anaphase nucleus (DAPI staining; blue) without a knob near the subtelomeric markers (Taz1-GFP in green and H3K9me3 in red). The lower panel shows DAPI staining in white marked with Taz1-GFP (green contours) and H3K9me3 foci (red contours) coexisting at a single chromosome end. The chromosomes are pulled in the direction of the arrows. The bar indicates 500 nm for c,d. (d) An optical section of a typical DAPI-stained nucleus containing two knobs, commonly found in HU-treated cells.

