
Figure 5. MERS-CoV Spike immunogens elicit potent, long-lived neutralization in NHPs and protect from severe lung infiltrates.
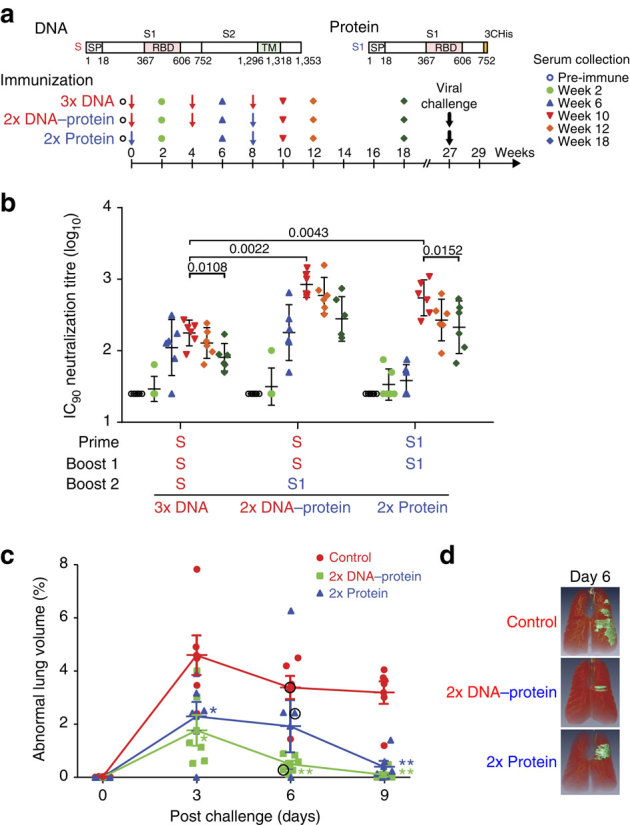
Selected immunogens from mouse studies were evaluated in NHPs. (a) Schematic representation of full-length MERS-CoV Spike protein cDNA and recombinant S1 protein. The DNA construct consists of full-length Spike and transmembrane domain. The protein construct contains a truncated Spike with the S1 subunit. RBD, receptor-binding domain; SP, signal peptide; TM, transmembrane domain; 3CHis, Human rhinovirus 3C protease cleavage site, followed by 6 × histidine tag. (b) Immunogenicity of three vaccine regimens. Six NHPs, per group, were immunized intramuscularly using plasmid DNA with electroporation at weeks 0, 4 and 8; plasmid DNA with electroporation at weeks 0 and 4; and protein plus AlPO4 at week 8 or protein plus AlPO4 at weeks 0 and 8. Two weeks after immunization and at weeks 12 and 18, neutralizing antibody titres were measured against pseudotyped MERS-CoV England1. Different symbols indicate sera from six NHPs per group collected at indicated time points. IC90 neutralization titres (GMT with 95% confidence interval) from sera were determined. Nonparametric two-tailed t-test (Mann–Whitney) was used for statistical analysis. (c) Spike immunogens protect against pulmonary disease in NHPs. Six unimmunized NHPs and 12 NHPs were immunized with one of two selected candidate vaccine immunogens ((1) full-length S DNA prime/S1 subunit protein boost; (2) S1 subunit protein prime/S1 subunit protein boost) and challenged with MERS-CoV 19 weeks after last vaccine boost. Intratracheal inoculation of 5 × 10⁶ p.f.u. of the JordanN3 strain (GenBank ID: KC776174.1) was performed on each animal. The per cent abnormal lung volume in all NHPs peaked on day 3 post challenge; however, the lung infiltrates were significantly more extensive and prolonged in the unvaccinated compared with vaccinated NHPs. A nonparametric two-tailed t-test (Mann–Whitney) was used. *P value <0.05; ** P value<0.01. (d) Abnormal lung segmental images from selected animals on day 6 post challenge. The images correspond to NHP lung volume data points circled in black in Fig. 5c. The CT images and abnormal lung segments for all 18 animals are shown in Supplementary Fig. 14 a–c.