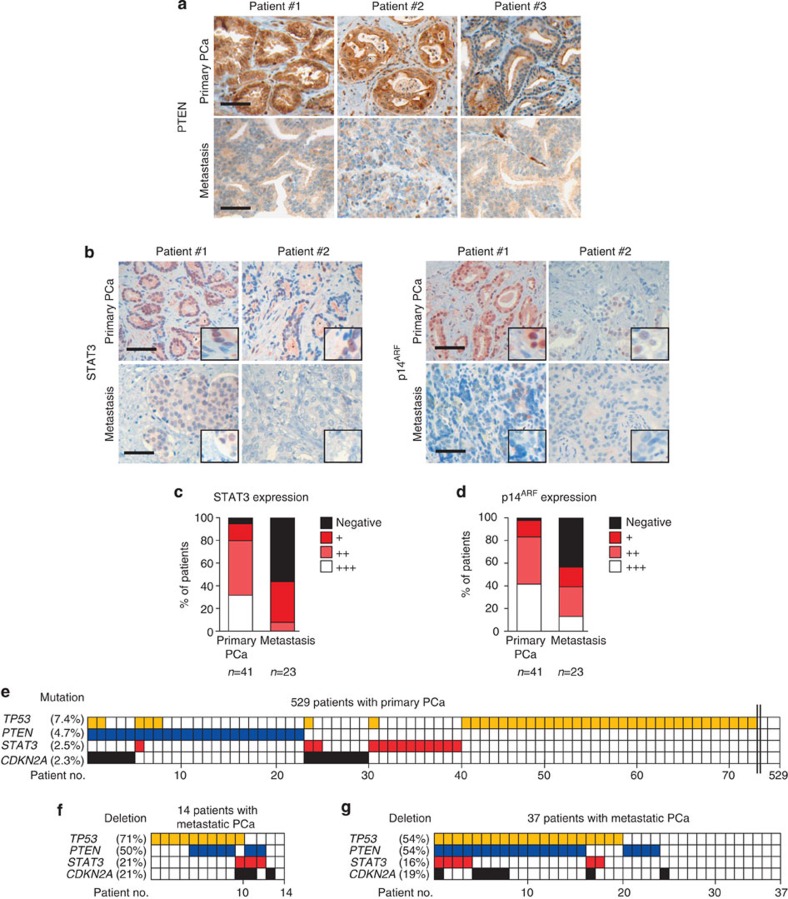
Figure 8. Loss of STAT3 and ARF in metastases of PCa patients.
(a) Three representative images of PTEN expression determined by IHC analyses in matched patient samples with primary and metastatic PCa (n=5). Scale bars, 100 μm. (b) Representative IHC images of STAT3 and p14ARF expression from primary (n=41) and metastatic (n=23) PCa samples. Scale bars, 100 μm. (c,d) STAT3 and p14ARF staining intensity ranging from undetectable (Negative) to maximal expression levels (+++) in cohorts of primary and metastatic PCa. (e) Graphical representation of TP53, PTEN, STAT3 and CDKN2A mutations in 529 patients with primary PCa71. (f) Graphical representation of TP53, PTEN, STAT3, CDKN2A deletions in 14 metastatic PCa55. Data were processed by Affymetrix Genome-Wide Human SNP Array 6.0. (g) Graphic representation of gene deletion analysis of TP53, PTEN, STAT3 and CDKN2A in an independent data set of 37 metastatic PCa samples35.

