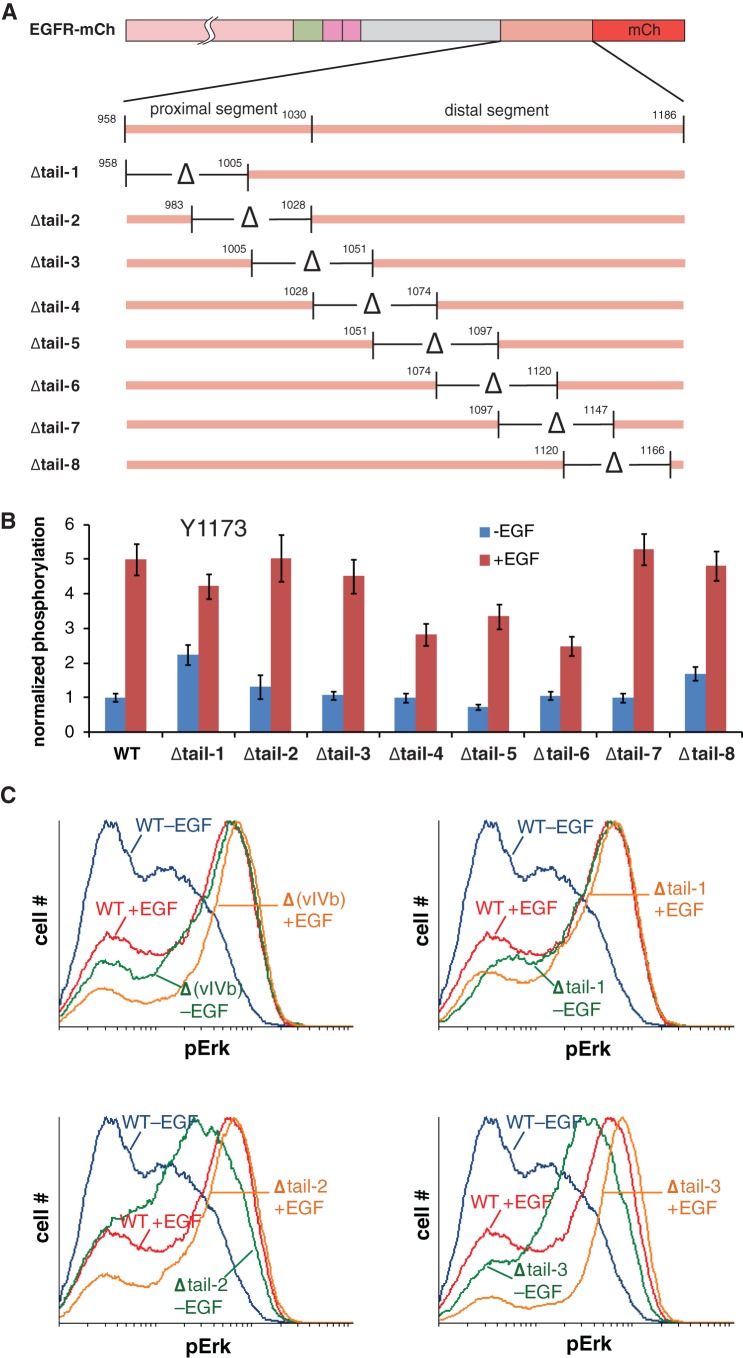
FIG 3.
An autoinhibitory function of the EGFR C-terminal tail maps to the entire proximal region deleted in the vIVb mutant. (A) Illustration of overlapping deletion mutants scanning the EGFR C-terminal tail. (B) Flow cytometry analysis of Tyr 1173 phosphorylation with EGFR tail mutants, with and without EGF stimulation. The analysis was performed as described in the legend to Fig. 2, and phosphorylation levels are normalized to unstimulated, wild-type EGFR-expressing cells. (C) Flow cytometry analysis of phospho-Erk1/2 (pErk) in cells expressing the vIVb deletion mutant [Δ(vIVb)] or selected deletion mutants depicted in panel A. Histograms of pErk signal are shown for cells expressing moderate amounts of EGFR constructs, with or without EGF stimulation. The data for each mutant are separately plotted, overlaid on the data for wild-type EGFR.

