FIG 7.
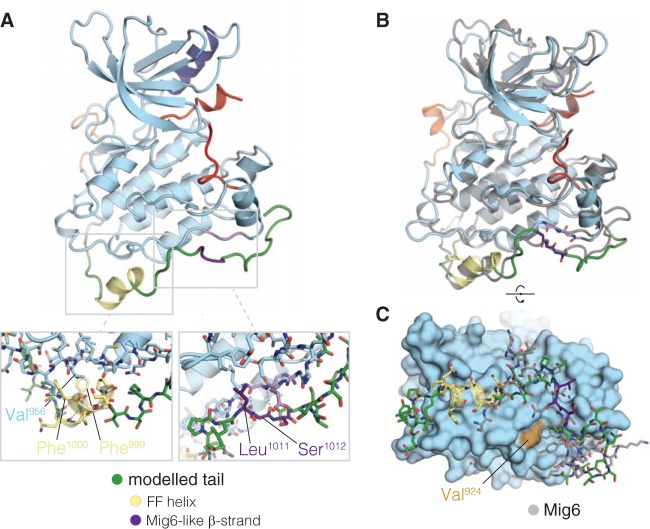
Proposed model for activator interface occlusion by the C-terminal tail. (A) Molecular dynamics simulation snapshot ∼5 ps after spontaneous formation of an α-helix, including Phe 999 and Phe 1000 of the tail (FF helix). Structural features are colored as follows: α-helix C in dark blue, activation loop in red, AP2 helix in orange, α-helix comprising Phe 999 and Phe 1000 in yellow, β-sheet forming a Mig6-like interaction in purple, and other modeled tail residues (991 to 1024) in green. The left inset shows the packing of residues Phe 999 and Phe 1000 against the C-lobe, as allowed by the helical conformation of the tail. The right inset shows the details of the β-sheet interaction formed between Ser 1012 and Leu 1014 of the tail and Gly 906 and Arg 908 of the C-lobe. (B) Overlaid snapshots at 7 ps and 307 ps after formation of the FF helix. The structures from the trajectory were aligned to the backbone atoms of residues 853 to 959 of PDB 2RFE, chain A. (C) Comparison of the conformation of Mig6 and the EGFR tail model after simulation. The snapshot 307 ps after formation of the FF helix is shown with the kinase domain as a surface and the modeled tail in stick representation. Mig6 (chain E from PDB 2RFE) is shown in gray. The simulation snapshot is aligned to the crystal structure as in panel B.

