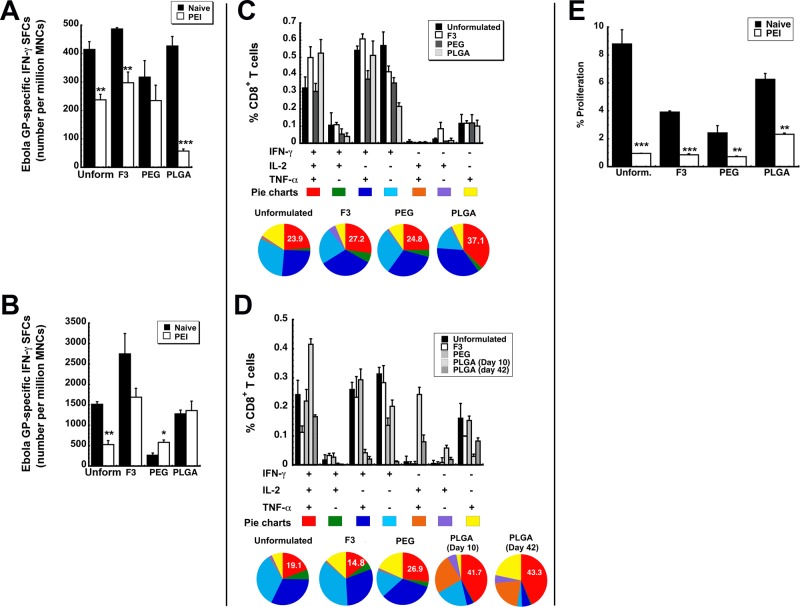
Figure 3.
Formulated preparations maintain antigen specific polyfunctional T cell responses in naive mice and those with prior exposure to adenovirus. Characterization of the immune response to Ebola glycoprotein was performed in B10.Br mice as described previously.12−14,24 (A) Magnitude of the systemic CD8+ T cell response against Ebola glycoprotein. The number of IFN-γ secreting mononuclear cells was quantitated in isolates taken 10 days after immunization from the spleen of naive B10.Br mice and those with prior-exposure to adenovirus by ELISpot. (B) Magnitude of the mucosal CD8+ T cell response against Ebola glycoprotein. The number of IFN-γ secreting mononuclear cells was quantitated 10 days after immunization in bronchoalveolar lavage (BAL) fluid of naive mice and those with prior-exposure to adenovirus by ELISpot. (C) Polyfunctionality of the Ebola glycoprotein-specific T cell response in naive mice. Ten days after immunization, splenocytes from 5 mice per treatment group were pooled and stimulated with an Ebola glycoprotein-specific peptide. Bar graphs illustrate the percentage of CD8+ tumor necrosis factor α (TNF-α)-, interleukin 2 (IL-2)-, and interferon γ (IFN-γ)-producing cells detected after 5 h of antigen stimulation. Distribution of single-, double-, and triple-cytokine-producing CD8+ T cells is shown as various colors in pie chart diagrams. The relative frequency of cells that produce all three cytokines defines the quality of the vaccine-induced CD8+ T cell response. The proportion of these cells (IFN-γ+IL-2+TNF-α+) generated in response to each treatment is written in the red section of each pie chart while the proportion of cells producing a single cytokine are represented by the light blue, purple, and yellow sections of each pie chart. (D) Polyfunctionality of the Ebola glycoprotein-specific T cell response in mice with prior exposure to adenovirus. Pre-existing immunity to adenovirus 5 was induced by instilling 5 × 10¹⁰ virus particles of AdNull, an E1/E3 deleted virus that does not contain a transgene cassette, in the nasal cavity of mice 28 days prior to immunization. Ten days after immunization, splenocytes were harvested and pooled as described in panel C. An increase in the number of polyfunctional cells, as indicated by an increase in the size of the red section of each pie graph, was fostered by several of the test formulations with respect to that produced by unformulated vaccine. (E) Quantitative analysis of the effector memory T cell response. Splenocytes were harvested 42 days after immunization, stained with CFSE, and stimulated with the TELRTFSI peptide for 5 days. Cells positive for CD8+, CD44HI, and CD62LLOW markers were then evaluated for CFSE by four-color flow cytometry. Data represent the average values obtained from three separate experiments each containing 5 mice per treatment. Error bars reflect the standard error of the data. *p < 0.05, **p < 0.01, ***p < 0.001, one-way ANOVA, Bonferroni/Dunn post hoc analysis.

