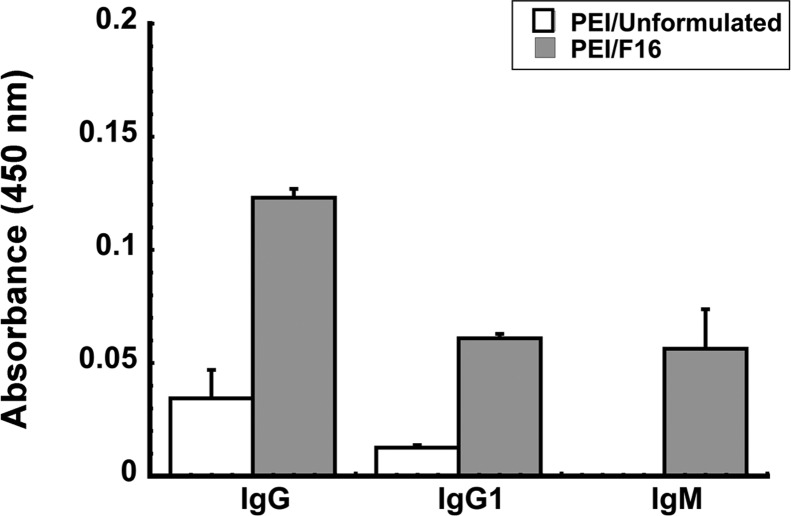
Figure 8.
Formulation F16 improves the antigen specific antibody response in mice with prior exposure to adenovirus. The average optical density read from individual samples obtained from each treatment group are presented to serve as a measure of relative antibody concentration and data reported as average values ± the standard error of the mean obtained from two separate experiments each containing 6 mice per treatment. The limit of detection for the assay is 0.01 absorbance unit. **p < 0.01, one-way ANOVA, Bonferroni/Dunn post hoc analysis.

