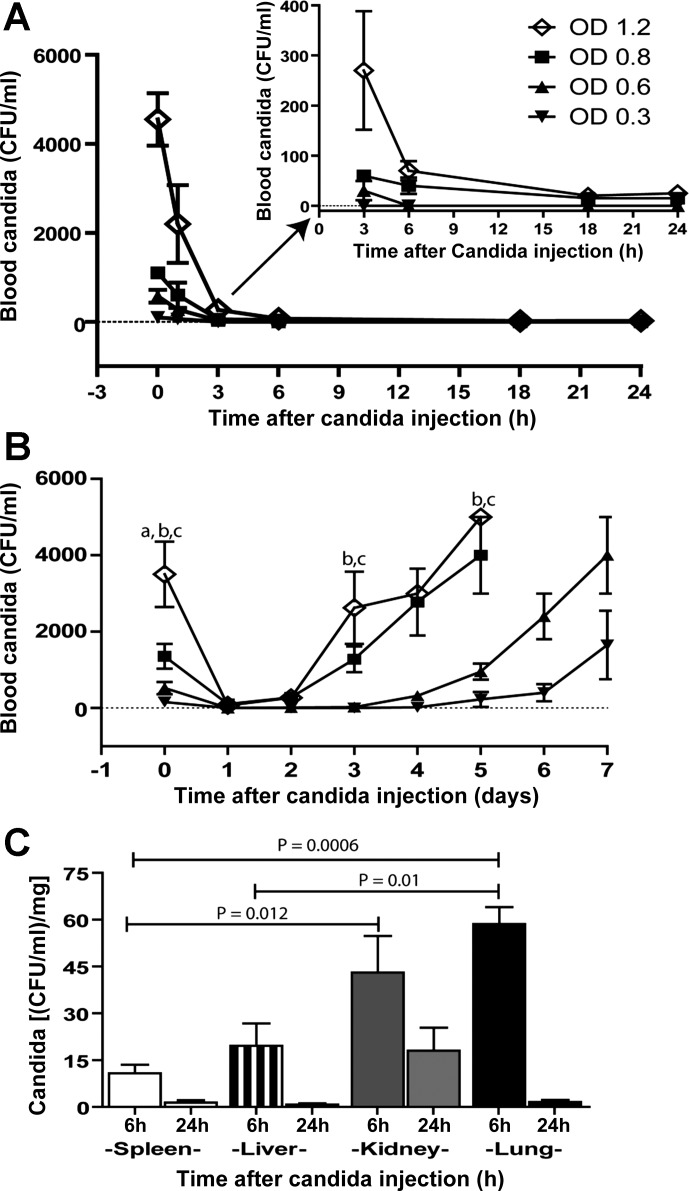
Fig. 2.
Characteristics of Candida injection model. Blood candidemia after administration of various doses of Candida at 24 h is demonstrated. A, inset: graph magnification is shown that indicates zero Candida blood level. B: candidemia at 7 days observation (B) (n = 5/time point). Candida burdens in different organs at 6 h and 24 h after Candida injection at the dose of optical density (OD) 630 nm 0.3 are shown (C) (n = 4–6/group). Measured parameters (means ± SE) were significantly different among the absorbance for fixed time point using one-way ANOVA followed by Bonferroni analysis with alpha set at 0.05 and four comparisons for A and B and eight comparisons for C. (a,b,cP < 0.05; a is OD 1.2 vs. OD 0.8, b is OD 1.2 vs. OD 0.6, and c is OD 1.2 vs. OD 0.3).

