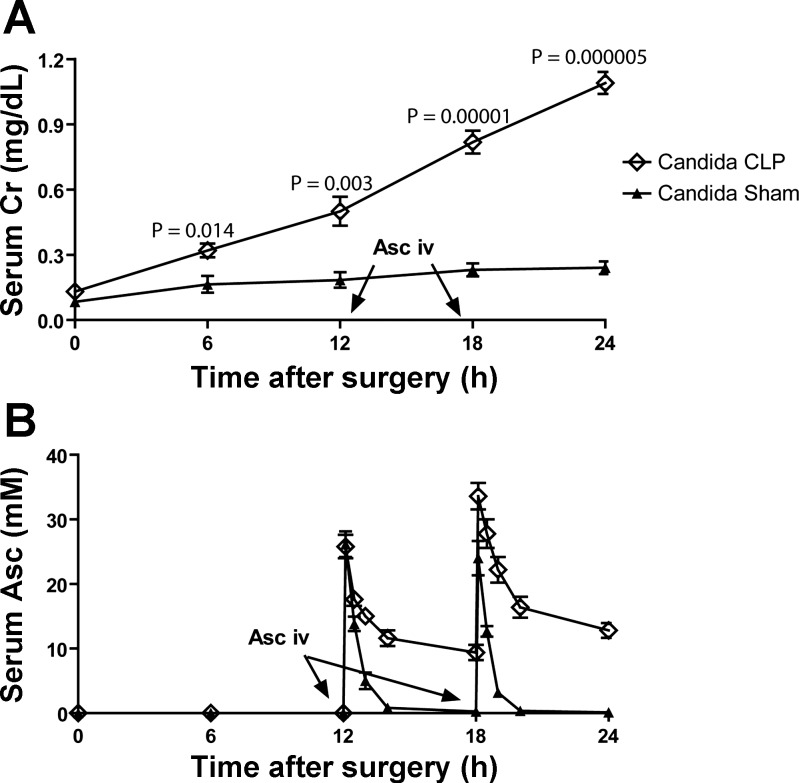
Fig. 6.
Time course of serum creatinine (serum Cr) and in vivo ascorbate level after intravenous injection. With Candida+CLP and Candida+Sham model, progression of kidney injury as measured by serum Cr (A), and serum ascorbate (serum Asc) level at baseline and time course after injection (B) is shown (n = 5 or 6/time point). Of note, serum ascorbate level at 24 h was 12.8 ± 1.2 mM. P values of the data (means ± SE) were compared between doses by the independent Student's t-test.

